অ্যাকচুয়াল প্যাটার্নস

প্যাটার্ন হলো গ্রাফিক্যাল মডেল, যা মূল্য ওঠানামার ভিত্তিতে চার্টে তৈরি হয়। টেকনিক্যাল বিশ্লেষণের নীতি অনুযায়ী, ইতিহাসের (প্রাইস মুভমেন্ট) পুনরাবৃত্তি ঘটে। অর্থাৎ, পরিস্থিতি যদি একই রকম থাকে তাহলে প্রাইস মুভমেন্টও প্রায় একই রকম হয়। এর ফলে মূল্যের ওঠানামা কেমন হবে তা আগেই থেকেই অনুমান করা যায়।
ইন্সটাফরেক্স এর প্রাসঙ্গিক প্যাটার্নসমূহ সহজেই ব্যবহার করা যায়, যার মাধ্যমে মার্কেটের সর্বশেষ পরিস্থিতি জানা যায় এবং তার উপর ভিত্তি করে সিদ্ধান্ত নেওয়া যায়। আমাদের সেবাগুলো থেকে আপনি যেকোনো পেয়ার এবং টাইমফ্রেমের জন্য সর্বশেষ এবং সবচেয়ে প্রাসঙ্গিক প্যাটার্নগুলো খুঁজে পাবেন।
Double Bottom
was formed on 04.04 at 20:00:33 (UTC+0)
signal strength 3 of 5
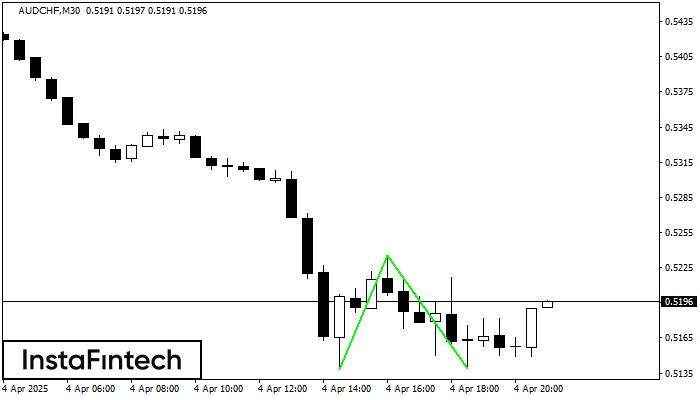
The Double Bottom pattern has been formed on AUDCHF M30; the upper boundary is 0.5235; the lower boundary is 0.5139. The width of the pattern is 97 points. In case of a break of the upper boundary 0.5235, a change in the trend can be predicted where the width of the pattern will coincide with the distance to a possible take profit level.
- All
- All
- Bearish Rectangle
- Bearish Symmetrical Triangle
- Bearish Symmetrical Triangle
- Bullish Rectangle
- Double Top
- Double Top
- Triple Bottom
- Triple Bottom
- Triple Top
- Triple Top
- All
- All
- Buy
- Sale
- All
- 1
- 2
- 3
- 4
- 5
बियरिश फ्लैग
was formed on 14.04 at 20:47:04 (UTC+0)
signal strength 3 of 5

बियरिश फ्लैग पैटर्न EURJPY पर M30 पर बना है। पैटर्न की निचली सीमा 162.05/162.27 पर स्थित है जबकि ऊपरी सीमा 162.33/162.55 पर स्थित है। फ्लैगपोल का प्रक्षेपण 88 पॉइंट्स है।
Open chart in a new window
बुलिश फ्लैग
was formed on 28.03 at 01:00:48 (UTC+0)
signal strength 3 of 5
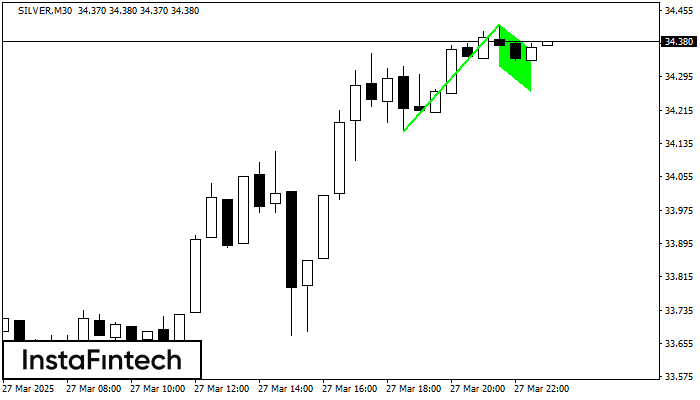
बुलिश फ्लैग पैटर्न SILVER पर M30 पर बना है। पैटर्न की निचली सीमा 34.32/34.26 पर स्थित है, जबकि उच्च सीमा 34.42/34.36 पर स्थित है। फ्लैगपोल का प्रक्षेपण 255 पॉइंट्स
Open chart in a new window
बुलिश फ्लैग
was formed on 10.03 at 13:49:20 (UTC+0)
signal strength 3 of 5
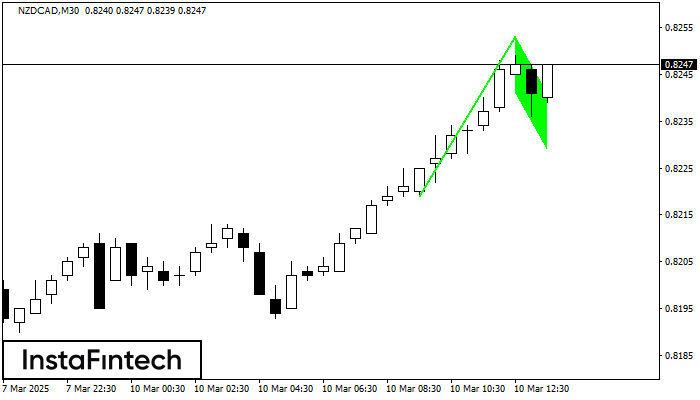
बुलिश फ्लैग पैटर्न NZDCAD M30 चार्ट पर बनाया गया है जो दर्शाता है कि ऊपर की ओर रुझान जारी रहेगा। संकेत: 0.8253 पर शिखर के टूटने से कीमत अधिक हो
Open chart in a new window