See also


 16.11.2021 04:42 AM
GBP/USD 5M
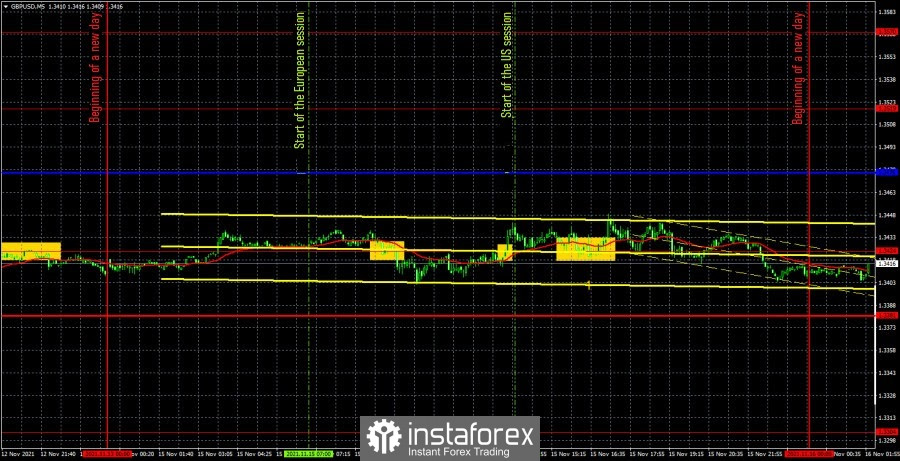
The GBP/USD pair, unlike EUR/USD, was in a 100% flat on Monday and passed exactly the same 48 points in a day. Thus, it was very difficult to trade the pound on Monday and, unfortunately, several trading signals were formed, which would have been better not. Nevertheless, they were formed, so traders could work them out. At first, the price settled below the extreme level of 1.3424, but managed to go down only 11 points after that. Thus, even the Stop Loss level could not be put up for short positions on the transaction. Traders had to manually close the short position at the beginning of the US trading session, as the price settled above the level of 1.3424, bringing a loss of 20 points. It was "very fortunate" that the price accelerated every time it overcame the 1.3424 level, as if wanting to make a bigger loss. At the buy signal, it was also necessary to open a position, but a long one. However, the upward movement also did not continue, but the price failed to settle below the level of 1.3424. Therefore, in the late afternoon, traders still had to be in open longs, which could bring them 5-6 points of profit and at least partially smooth out the negative result of the first transaction. But the day was still very unfortunate. The figure "1" in the chart marks the time when Bank of England Governor Andrew Bailey delivered a speech, but, as we can see, after that the price went up about 20 points with grief, which can hardly be considered a market reaction. Thus, the fundamental background had no effect on the pound/dollar pair yesterday, and the macroeconomic background was simply absent.
GBP/USD 1H
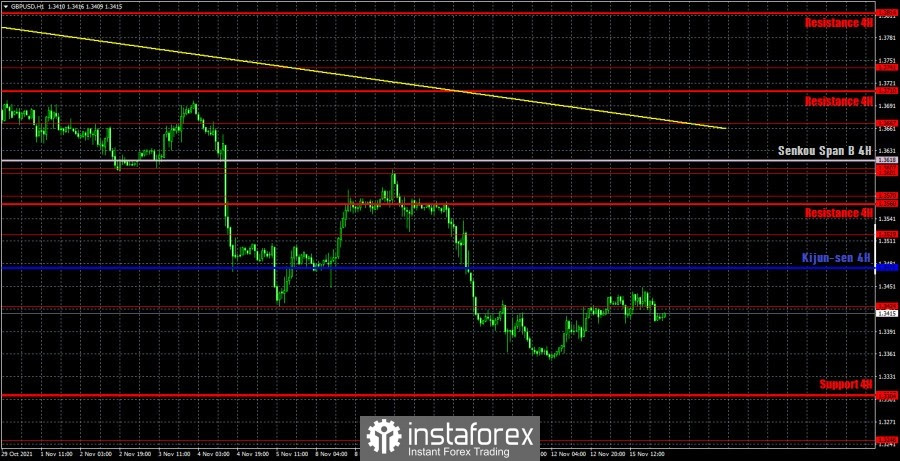
The pound/dollar pair maintains a downward trend on the hourly timeframe, but continues to be quite far from the trend line. At the moment, the upward correction is continuing, but the price has not managed to reach the critical line in a few days yet – the movement is so weak now. Thus, as long as the price is below the Kijun-sen line, the downward movement can resume at any moment. If the bulls overcome this line, the correction may continue with the goals of the Senkou Span B line and the trend line. We highlight the following important levels on November 16: 1,3246, 1,3304, 1,3424, 1,3519, 1,3570. The Senkou Span B (1.3618) and Kijun-sen (1.3475) lines can also be signal sources. It is recommended to set the Stop Loss level to breakeven when the price passes in the right direction by 20 points. The lines of the Ichimoku indicator can move during the day, which should be taken into account when searching for trading signals. Reports on unemployment, applications for unemployment benefits, as well as changes in average wages will be published in the UK on Tuesday. We do not consider these reports important, therefore, if the reaction of the markets follows them, it is unlikely to be strong. A much more important report will be released in America - retail sales.
We recommend you to familiarize yourself:
Overview of the EUR/USD pair. November 16. The dollar is growing 6 points a day on average. Christine Lagarde did not surprise the markets.
Overview of the GBP/USD pair. November 16. Scotland continues to voice its grudge against London's dependence.
Forecast and trading signals for EUR/USD for November 16. Detailed analysis of the movement of the pair and trade deals.
COT report
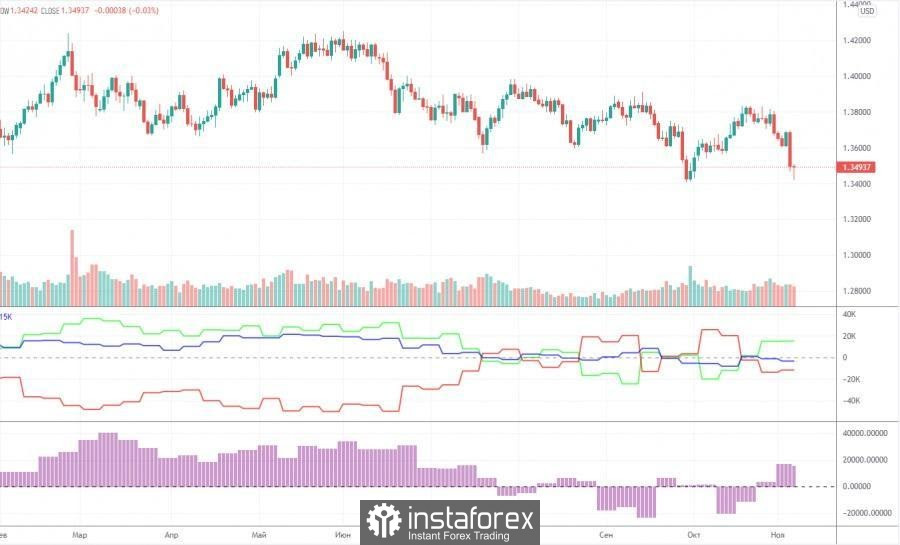
The mood of professional traders practically did not change during the last reporting week (October 26-November 1). However, it should be noted that the two most important days of last week – Wednesday and Thursday - when all the strongest movements occurred, were not included in the latest report. That is, in a week we will be able to see how much and in which direction the mood of professional traders has changed. In the meantime, we can only draw the same conclusions as a week ago. The green and red lines of the first indicator continue to constantly change the direction of movement, constantly intersecting. This suggests that big players themselves do not understand what to do with the pound. However, this can be clearly seen from the very schedule of the pair's movement, starting from July. These four months, the pound/dollar pair has been between the levels of 1.3400 and 1.4000, that is, in the horizontal channel. It was during this period of time that commercial and non-commercial traders changed their mood almost every week. Thus, taking into account the previous changes, we would assume that a new growth of the British currency will begin in the near future with the prospect of a 500-point rise. Moreover, the results of the Bank of England meeting were not dovish. The British currency has fallen undeservedly, which means that the markets may soon recoup this injustice. It should also be noted that during the reporting week, professional traders opened 5.8 buy contracts (longs) and 7.5 thousand sell contracts (shorts). Thus, the net position has not changed much.
Explanations for the chart:
Support and Resistance Levels are the levels that serve as targets when buying or selling the pair. You can place Take Profit near these levels.
Kijun-sen and Senkou Span B lines are lines of the Ichimoku indicator transferred to the hourly timeframe from the 4-hour one.
Support and resistance areas are areas from which the price has repeatedly rebounded off.
Yellow lines are trend lines, trend channels and any other technical patterns.
Indicator 1 on the COT charts is the size of the net position of each category of traders.
Indicator 2 on the COT charts is the size of the net position for the non-commercial group.
You have already liked this post today
*The market analysis posted here is meant to increase your awareness, but not to give instructions to make a trade.
The GBP/USD currency pair continued its upward movement on Monday as it did last week. The only difference was the strength of the movement. On Monday, volatility was very high—without
Analysis of Friday's Trades 1H Chart of GBP/USD On Friday, the GBP/USD pair showed extremely low volatility, yet the British pound steadily crept upward even with such market conditions
Analysis of Friday's Trades 1H Chart of EUR/USD The EUR/USD currency pair showed no movement on Friday. It was Good Friday, and Easter Sunday followed. As a result, many countries
The GBP/USD currency pair traded higher again on Friday, albeit with minimal volatility. Despite the lack of important events in the U.S. or the U.K. that day (unlike earlier
Analysis of Thursday's Trades 1H Chart of GBP/USD The GBP/USD pair continued to trade higher throughout Thursday. Even at its peak levels, the British pound shows no intention of correcting
Analysis of Thursday's Trades 1H Chart of EUR/USD The EUR/USD currency pair continued trading within a sideways channel on Thursday, as shown on the hourly timeframe chart above. The current
Forex Chart
Web-version

Your IP address shows that you are currently located in the USA. If you are a resident of the United States, you are prohibited from using the services of InstaFintech Group including online trading, online transfers, deposit/withdrawal of funds, etc.
If you think you are seeing this message by mistake and your location is not the US, kindly proceed to the website. Otherwise, you must leave the website in order to comply with government restrictions.
Why does your IP address show your location as the USA?
Please confirm whether you are a US resident or not by clicking the relevant button below. If you choose the wrong option, being a US resident, you will not be able to open an account with InstaTrade anyway.
We are sorry for any inconvenience caused by this message.


