See also


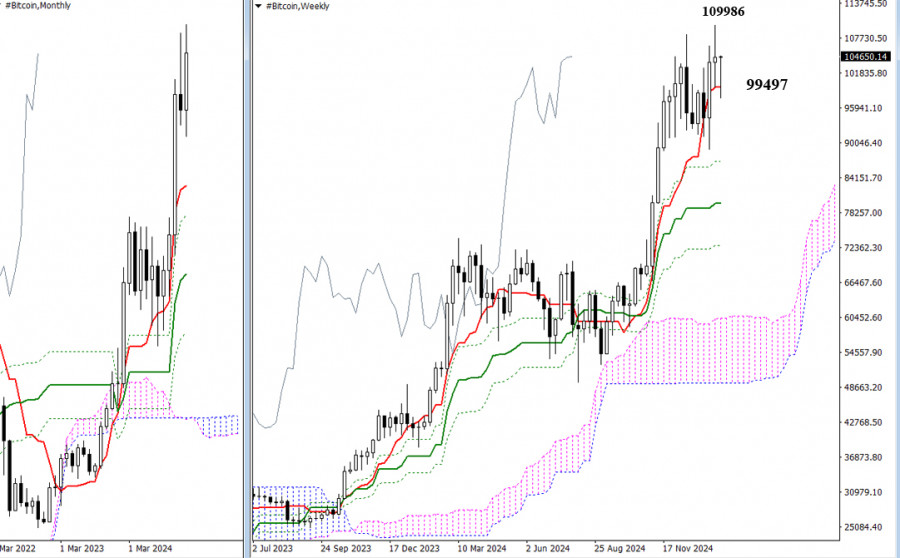
Bitcoin reached a new high last week at 109,986 but has since paused its upward movement, entering a phase of uncertainty. Currently, a long lower shadow has formed on the weekly timeframe, extending down to the short-term trend support level of 99,497. The main question now is whether the bulls will regain control and push prices higher for the remainder of the week, or if uncertainty will continue to dominate.
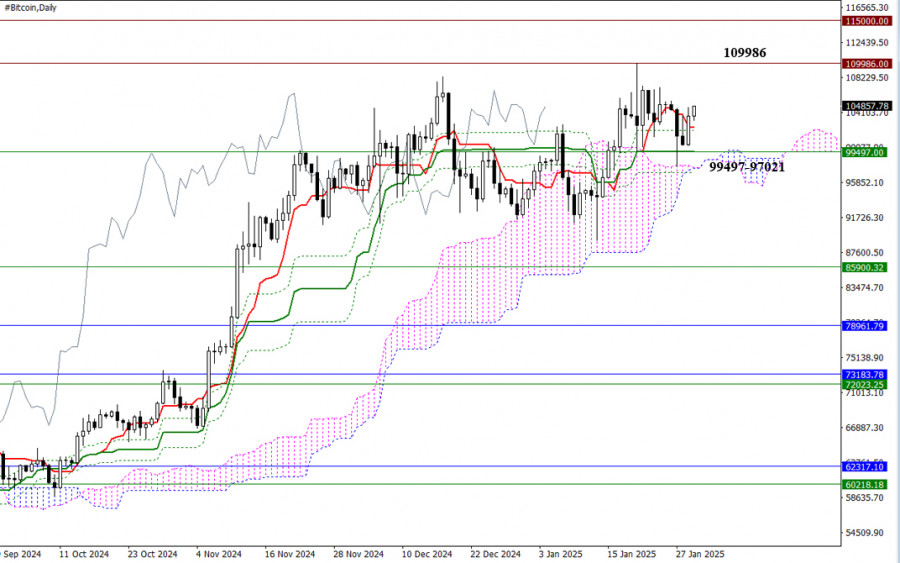
In the daily timeframe, the influence of the Ichimoku daily cross (102,383 – 99,497 – 97,021) and the daily cloud (97,538) is contributing to the ongoing uncertainty. If bearish traders manage to break through the established support levels and maintain consolidation below them, new opportunities could arise for them. Conversely, if bulls maintain control and rebound from the current support zone, they might aim to retest the previous high of 109,986 and potentially establish new peaks. In this scenario, the psychological levels of 112000, 113000, 114000, and 115000 will serve as upside targets.
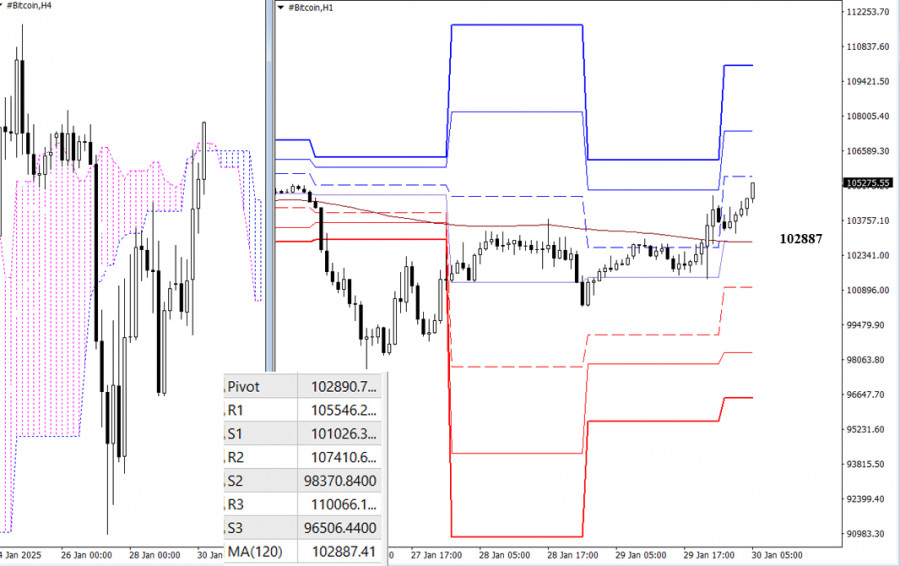
On lower timeframes, Bitcoin has successfully risen above the long-term weekly trend level of 102,887. However, the H4 Ichimoku cloud resistance, which ranges from 104,889 to 104,743, is currently limiting further growth. The key reference points for potential upward movement today are the resistance levels from the classic Pivot points, which can be identified at 105546 - 107411 - 110066. A break above the cloud would signal additional bullish momentum. Conversely, if bearish sentiment takes hold, we could see a rebound from the H4 cloud. This would bring us back to key levels, which today align in the area of 102887. Consolidation below this level, along with a subsequent reversal, would shift momentum in favor of stronger bearish sentiment. The downward reference points in this scenario would be the support levels from the classic Pivot points at 101026 - 98371 - 96506.
***
You have already liked this post today
*The market analysis posted here is meant to increase your awareness, but not to give instructions to make a trade.


Forex Chart
Web-version

Your IP address shows that you are currently located in the USA. If you are a resident of the United States, you are prohibited from using the services of InstaFintech Group including online trading, online transfers, deposit/withdrawal of funds, etc.
If you think you are seeing this message by mistake and your location is not the US, kindly proceed to the website. Otherwise, you must leave the website in order to comply with government restrictions.
Why does your IP address show your location as the USA?
Please confirm whether you are a US resident or not by clicking the relevant button below. If you choose the wrong option, being a US resident, you will not be able to open an account with InstaTrade anyway.
We are sorry for any inconvenience caused by this message.


