Voir aussi


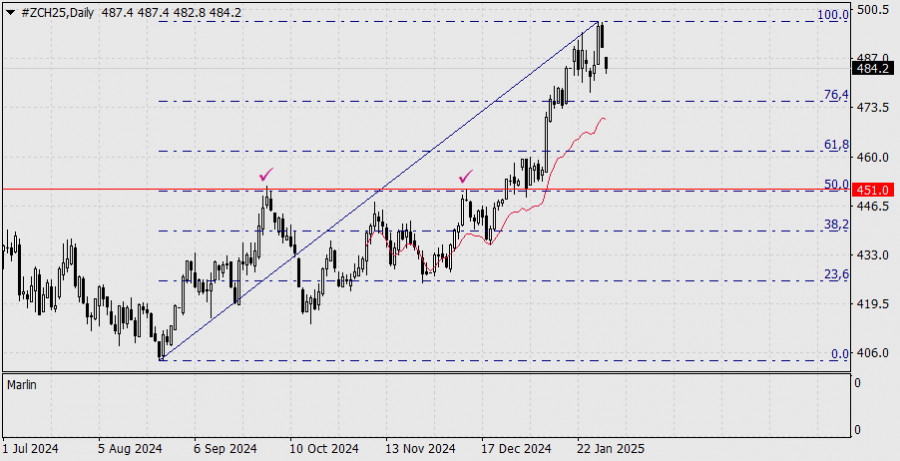
Sur le graphique journalier du contrat à terme sur le maïs pour mars, il y a eu un retournement brutal. La grille Fibonacci, appliquée à l'ensemble du mouvement depuis le plus bas du mois d'août dernier, indique une structure de mouvement correcte, avec le niveau le plus fort à 50,0 %, correspondant à un prix de 451,0. Il est probable que le prix se dirige vers ce niveau.
L'oscillateur MACD s'est retourné presque depuis la zone de surachat. L'oscillateur Marlin n'est pas affiché en raison de données historiques insuffisantes.
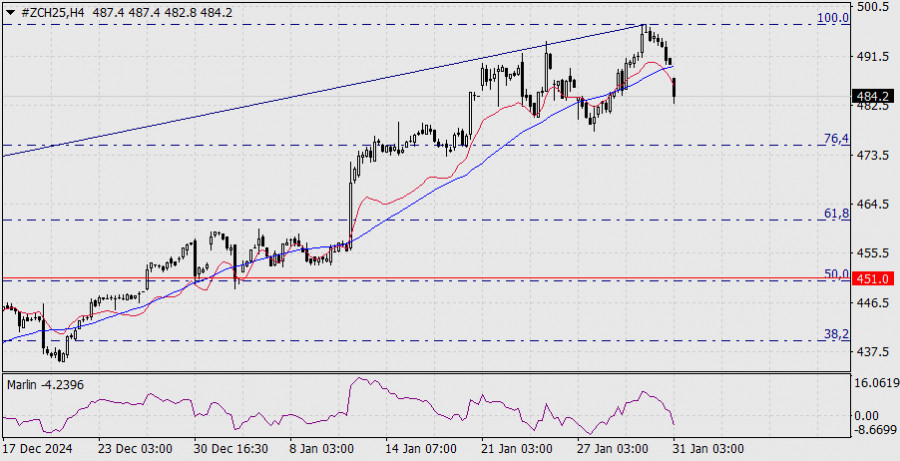
Sur le graphique H4, l'oscillateur Marlin est actif et entre dans une tendance baissière. Le prix s'est consolidé en dessous à la fois de la ligne MACD et de la ligne d'équilibre. Nous prévoyons que le prix atteindra le niveau cible de 451.0.
You have already liked this post today
*The market analysis posted here is meant to increase your awareness, but not to give instructions to make a trade.


Club InstaForex

Your IP address shows that you are currently located in the USA. If you are a resident of the United States, you are prohibited from using the services of InstaFintech Group including online trading, online transfers, deposit/withdrawal of funds, etc.
If you think you are seeing this message by mistake and your location is not the US, kindly proceed to the website. Otherwise, you must leave the website in order to comply with government restrictions.
Why does your IP address show your location as the USA?
Please confirm whether you are a US resident or not by clicking the relevant button below. If you choose the wrong option, being a US resident, you will not be able to open an account with InstaTrade anyway.
We are sorry for any inconvenience caused by this message.


