Actual patterns

Patterns are graphical models which are formed in the chart by the price. According to one of the technical analysis postulates, history (price movement) repeats itself. It means that the price movements are often similar in the same situations which makes it possible to predict the further development of the situation with a high probability.
Relevant patterns by InstaTrade is an easy-to-use service which allows you to be aware of latest changes in the market and react to clues from the market in time. In our service you will always find the latest and most relevant patterns on any pair and any timeframe.
Triple Top
was formed on 31.03 at 08:30:26 (UTC+0)
signal strength 3 of 5

The Triple Top pattern has formed on the chart of the EURCAD M30. Features of the pattern: borders have an ascending angle; the lower line of the pattern has the coordinates 1.5476/1.5505 with the upper limit 1.5517/1.5519; the projection of the width is 41 points. The formation of the Triple Top figure most likely indicates a change in the trend from upward to downward. This means that in the event of a breakdown of the support level of 1.5476, the price is most likely to continue the downward movement.
- All
- All
- Bearish Rectangle
- Bearish Symmetrical Triangle
- Bearish Symmetrical Triangle
- Bullish Rectangle
- Double Top
- Double Top
- Triple Bottom
- Triple Bottom
- Triple Top
- Triple Top
- All
- All
- Buy
- Sale
- All
- 1
- 2
- 3
- 4
- 5
Bandeira de Baixa
was formed on 21.04 at 03:52:15 (UTC+0)
signal strength 2 of 5

O padrão Bandeira de Baixa foi formado em USDJPY em M15. O limite inferior do padrão está localizado em 140.89/141.19, enquanto o limite superior está em 141.19/141.49. A projeção
Os intervalos M5 e M15 podem ter mais pontos de entrada falsos.
Open chart in a new window
Pennant de baixa
was formed on 21.04 at 03:52:10 (UTC+0)
signal strength 2 of 5
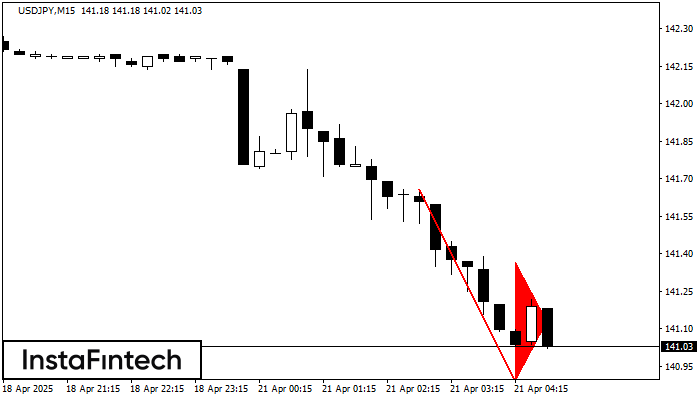
O padrão Pennant de baixa foi formado no gráfico USDJPY M15. O padrão sinaliza a continuação da tendência de baixa caso o pennant de baixa de 140.89 for quebrada. Recomendações
Os intervalos M5 e M15 podem ter mais pontos de entrada falsos.
Open chart in a new window
Fundo duplo
was formed on 21.04 at 02:15:11 (UTC+0)
signal strength 2 of 5
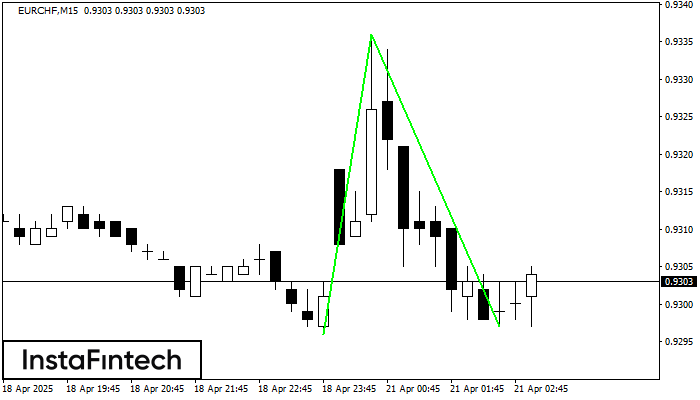
O padrão Fundo duplo foi formado em EURCHF M15. Características: o nível de suporte 0.9296; o nível de resistência 0.9336; a largura do padrão 40 pontos. Se o nível
Os intervalos M5 e M15 podem ter mais pontos de entrada falsos.
Open chart in a new window