Pola sebenarnya

Bearish Rectangle
was formed on 18.03 at 15:36:48 (UTC+0)
signal strength 1 of 5
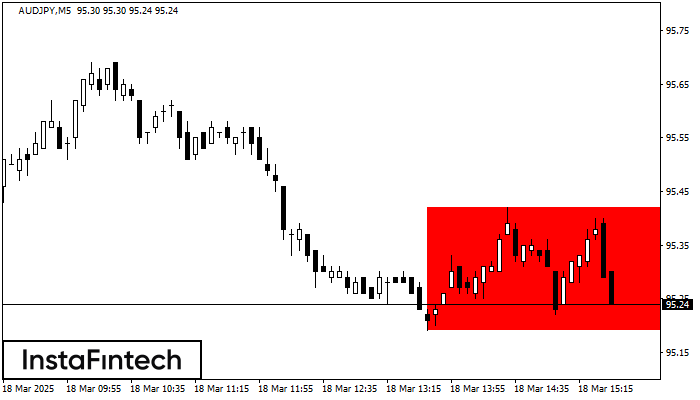
According to the chart of M5, AUDJPY formed the Bearish Rectangle. This type of a pattern indicates a trend continuation. It consists of two levels: resistance 95.42 - 0.00 and support 95.19 – 95.19. In case the resistance level 95.19 - 95.19 is broken, the instrument is likely to follow the bearish trend.
The M5 and M15 time frames may have more false entry points.
Lihat juga
- All
- All
- Bearish Rectangle
- Bearish Symmetrical Triangle
- Bearish Symmetrical Triangle
- Bullish Rectangle
- Double Top
- Double Top
- Triple Bottom
- Triple Bottom
- Triple Top
- Triple Top
- All
- All
- Buy
- Sale
- All
- 1
- 2
- 3
- 4
- 5
Inverse Head and Shoulder
was formed on 21.03 at 19:50:04 (UTC+0)
signal strength 1 of 5
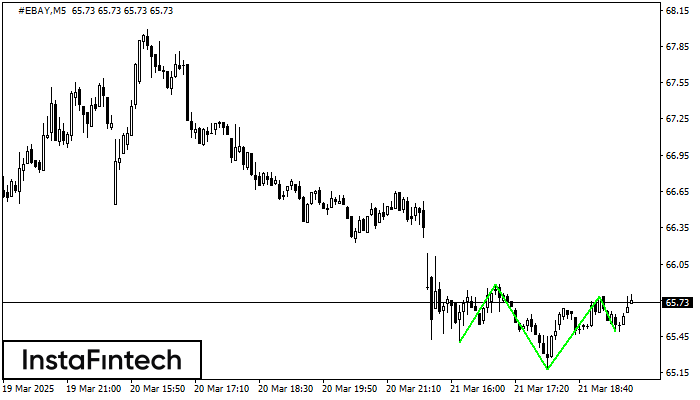
According to the chart of M5, #EBAY formed the Inverse Head and Shoulder pattern. The Head’s top is set at 65.78 while the median line of the Neck is found
The M5 and M15 time frames may have more false entry points.
Open chart in a new window
Bullish Symmetrical Triangle
was formed on 21.03 at 19:35:14 (UTC+0)
signal strength 1 of 5
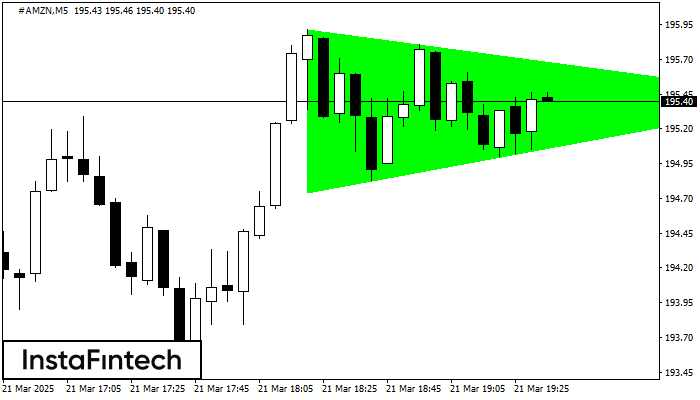
According to the chart of M5, #AMZN formed the Bullish Symmetrical Triangle pattern. The lower border of the pattern touches the coordinates 194.75/195.42 whereas the upper border goes across 195.92/195.42
The M5 and M15 time frames may have more false entry points.
Open chart in a new window
Bearish Symmetrical Triangle
was formed on 21.03 at 19:32:08 (UTC+0)
signal strength 2 of 5
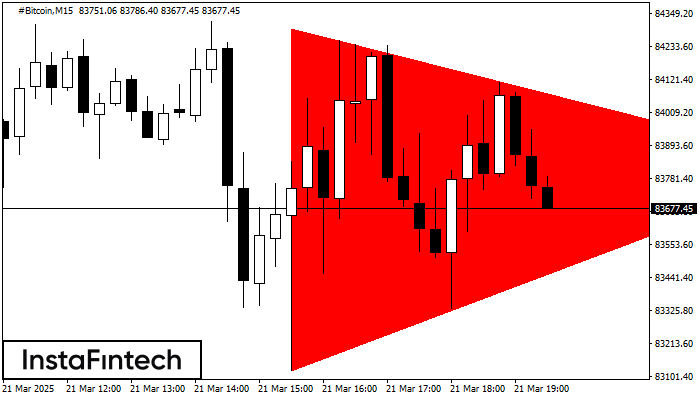
According to the chart of M15, #Bitcoin formed the Bearish Symmetrical Triangle pattern. Description: The lower border is 83121.29/83823.64 and upper border is 84297.08/83823.64. The pattern width is measured
The M5 and M15 time frames may have more false entry points.
Open chart in a new window