Pola sebenarnya

Bullish Symmetrical Triangle
was formed on 18.03 at 15:44:52 (UTC+0)
signal strength 1 of 5
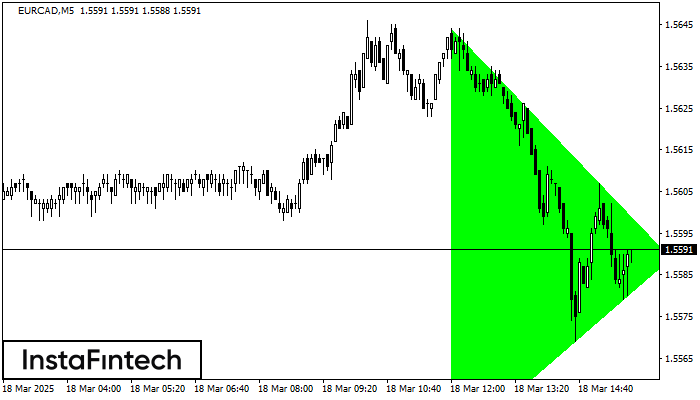
According to the chart of M5, EURCAD formed the Bullish Symmetrical Triangle pattern. Description: This is the pattern of a trend continuation. 1.5644 and 1.5543 are the coordinates of the upper and lower borders respectively. The pattern width is measured on the chart at 101 pips. Outlook: If the upper border 1.5644 is broken, the price is likely to continue its move by 1.5604.
The M5 and M15 time frames may have more false entry points.
Lihat juga
- All
- All
- Bearish Rectangle
- Bearish Symmetrical Triangle
- Bearish Symmetrical Triangle
- Bullish Rectangle
- Double Top
- Double Top
- Triple Bottom
- Triple Bottom
- Triple Top
- Triple Top
- All
- All
- Buy
- Sale
- All
- 1
- 2
- 3
- 4
- 5
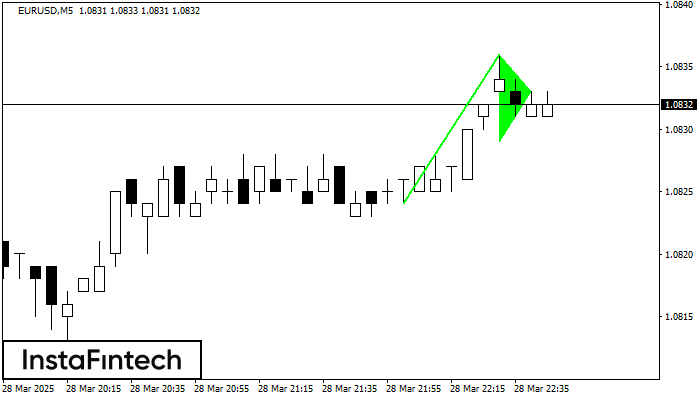
Bendera Bullish
was formed on 28.03 at 22:48:48 (UTC+0)
signal strength 1 of 5

Pola Bendera Bullish telah terbentuk di grafik EURUSD M5, yang memberikan sinyal tren naik akan berlanjut. Sinyal: penembusan titik puncak di 1.0836 mungkin mendorong harga lebih tinggi, dan kenaikan akan
Rangka waktu M5 dan M15 mungkin memiliki lebih dari titik entri yang keliru.
Open chart in a new window
Panji Bullish
was formed on 28.03 at 22:48:43 (UTC+0)
signal strength 1 of 5
Pola grafik Panji Bullish telah terbentuk di instrumen EURUSD M5. Jenis pola ini terjadi pada kategori pola kelanjutan. Dalam kasus ini, jika kuotasi dapat menembus titik tertinggi, harga diperkirakan akan
Rangka waktu M5 dan M15 mungkin memiliki lebih dari titik entri yang keliru.
Open chart in a new window
Persegi Bullish
was formed on 28.03 at 22:34:02 (UTC+0)
signal strength 3 of 5

Menurut grafik dari M30, GOLD terbentuk Persegi Bullish yang merupakan pola dari kelanjutan tren. Pola terkandung dalam batas berikut: batas yang lebih rendah 3065.51 – 3065.51 dan batas atas 3086.32
Open chart in a new window