Pola sebenarnya

Head and Shoulders
was formed on 21.03 at 05:06:39 (UTC+0)
signal strength 1 of 5
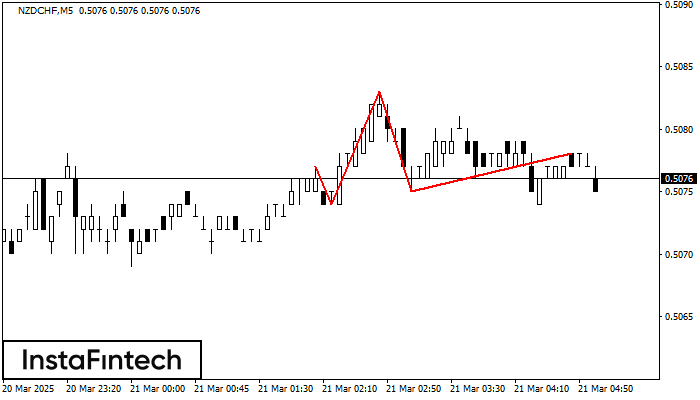
The NZDCHF M5 formed the Head and Shoulders pattern with the following features: The Head’s top is at 0.5083, the Neckline and the upward angle are at 0.5074/0.5075. The formation of this pattern can bring about changes in the current trend from bullish to bearish. In case the pattern triggers the expected changes, the price of NZDCHF will go towards 0.5060.
The M5 and M15 time frames may have more false entry points.
Lihat juga
- All
- All
- Bearish Rectangle
- Bearish Symmetrical Triangle
- Bearish Symmetrical Triangle
- Bullish Rectangle
- Double Top
- Double Top
- Triple Bottom
- Triple Bottom
- Triple Top
- Triple Top
- All
- All
- Buy
- Sale
- All
- 1
- 2
- 3
- 4
- 5
Teratas Ganda
was formed on 31.03 at 18:31:19 (UTC+0)
signal strength 1 of 5
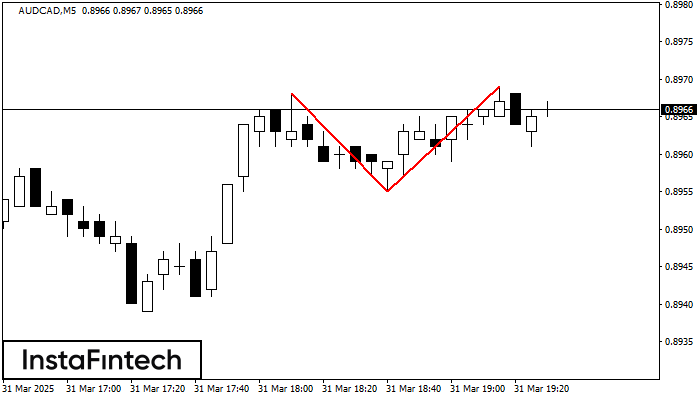
Pola reversal Teratas Ganda telah terbentuk pada AUDCAD M5. Karakteristik: batas atas 0.8968; batas bawah 0.8955; lebar pola 14 poin. Transaksi jual lebih baik dibuka di bawah batas bawah 0.8955
Rangka waktu M5 dan M15 mungkin memiliki lebih dari titik entri yang keliru.
Open chart in a new window
Panji Bearish
was formed on 31.03 at 18:00:53 (UTC+0)
signal strength 3 of 5

Pola Panji Bearish telah terbentuk di grafik #NTDOY M30. Jenis pola ini memiliki ciri sedikit perlambatan yang setelahnya harga akan bergerak ke arah tren sebenarnya. Jika harga ditetapkan di bawah
Open chart in a new window
Panji Bearish
was formed on 31.03 at 18:00:41 (UTC+0)
signal strength 3 of 5

Pola Panji Bearish telah terbentuk di grafik #NTDOY M30. Pola ini memberikan sinyal potensi kelanjutan tren yang ada. Spesifikasi: titik terendah pola berkoordinat di 16.77; proyeksi titik tertinggi sama dengan
Open chart in a new window