Pola sebenarnya

Bullish Symmetrical Triangle
was formed on 21.03 at 19:35:14 (UTC+0)
signal strength 1 of 5
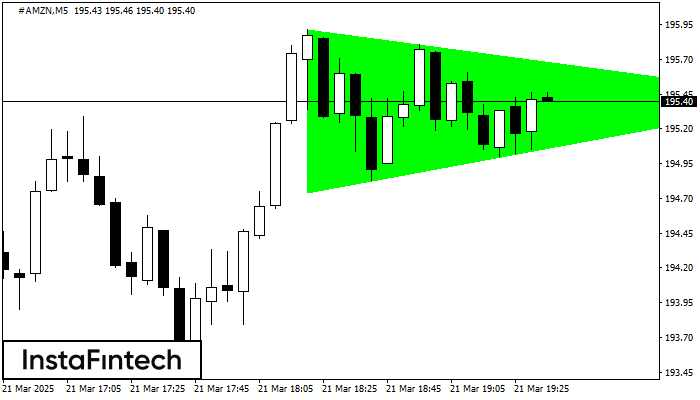
According to the chart of M5, #AMZN formed the Bullish Symmetrical Triangle pattern. The lower border of the pattern touches the coordinates 194.75/195.42 whereas the upper border goes across 195.92/195.42. If the Bullish Symmetrical Triangle pattern is in progress, this evidently signals a further upward trend. In other words, in case the scenario comes true, the price of #AMZN will breach the upper border to head for 195.57.
The M5 and M15 time frames may have more false entry points.
Lihat juga
- All
- All
- Bearish Rectangle
- Bearish Symmetrical Triangle
- Bearish Symmetrical Triangle
- Bullish Rectangle
- Double Top
- Double Top
- Triple Bottom
- Triple Bottom
- Triple Top
- Triple Top
- All
- All
- Buy
- Sale
- All
- 1
- 2
- 3
- 4
- 5
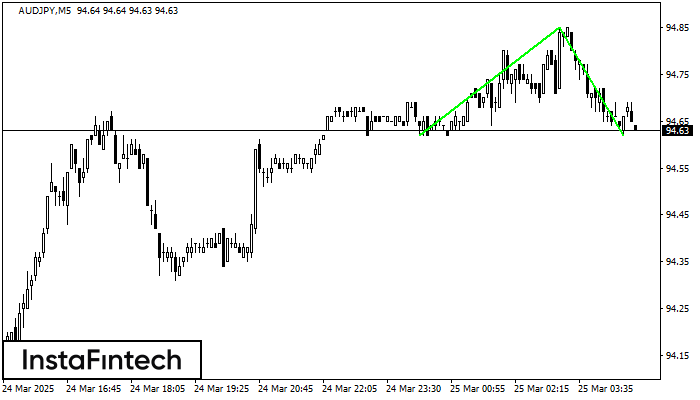
Kepala dan bahu
was formed on 25.03 at 04:50:35 (UTC+0)
signal strength 1 of 5

Pola teknikal yang disebut Kepala dan bahu telah muncul pada grafik AUDJPY M5. Terdapat banyak alasan untuk harga melewati Neckline 94.62/94.62 setelah Shoulder kanan terbentuk. Jadi, tren akan berubah dengan
Rangka waktu M5 dan M15 mungkin memiliki lebih dari titik entri yang keliru.
Open chart in a new window
Bawah Ganda
was formed on 25.03 at 04:45:36 (UTC+0)
signal strength 1 of 5
Pola Bawah Ganda telah terbentuk pada AUDJPY M5; batas atas di 94.85; batas bawah di 94.62. Lebar pola sebesar 23 poin. Jika harga menembus batas atas 94.85, Perubahan dalam tren
Rangka waktu M5 dan M15 mungkin memiliki lebih dari titik entri yang keliru.
Open chart in a new window
Kepala dan bahu
was formed on 25.03 at 04:15:36 (UTC+0)
signal strength 1 of 5

Menurut grafik M5, USDJPY membentuk pola Kepala dan bahu. Puncak The Head ditetapkan di 150.87 sementara garis median the Neck ditemukan di 150.68/150.70. Formasi pola Kepala dan bahu terbukti mensinyalkan
Rangka waktu M5 dan M15 mungkin memiliki lebih dari titik entri yang keliru.
Open chart in a new window