Pola sebenarnya

Triple Top
was formed on 21.03 at 20:35:56 (UTC+0)
signal strength 1 of 5
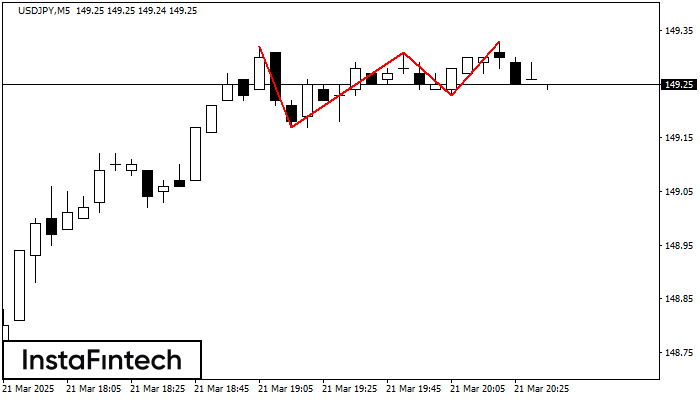
The Triple Top pattern has formed on the chart of the USDJPY M5. Features of the pattern: borders have an ascending angle; the lower line of the pattern has the coordinates 149.17/149.23 with the upper limit 149.32/149.33; the projection of the width is 15 points. The formation of the Triple Top figure most likely indicates a change in the trend from upward to downward. This means that in the event of a breakdown of the support level of 149.17, the price is most likely to continue the downward movement.
The M5 and M15 time frames may have more false entry points.
Lihat juga
- All
- All
- Bearish Rectangle
- Bearish Symmetrical Triangle
- Bearish Symmetrical Triangle
- Bullish Rectangle
- Double Top
- Double Top
- Triple Bottom
- Triple Bottom
- Triple Top
- Triple Top
- All
- All
- Buy
- Sale
- All
- 1
- 2
- 3
- 4
- 5
Bullish Symmetrical Triangle
was formed on 25.03 at 05:33:06 (UTC+0)
signal strength 1 of 5

According to the chart of M5, USDJPY formed the Bullish Symmetrical Triangle pattern, which signals the trend will continue. Description. The upper border of the pattern touches the coordinates 150.95/150.72
The M5 and M15 time frames may have more false entry points.
Open chart in a new window
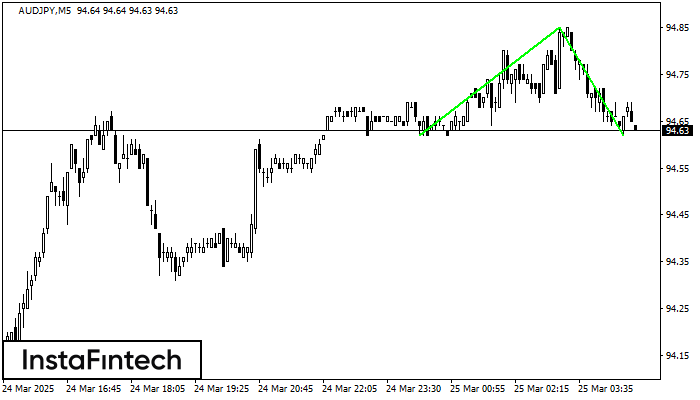
Head and Shoulders
was formed on 25.03 at 04:50:35 (UTC+0)
signal strength 1 of 5

The technical pattern called Head and Shoulders has appeared on the chart of AUDJPY M5. There are weighty reasons to suggest that the price will surpass the Neckline 94.62/94.62 after
The M5 and M15 time frames may have more false entry points.
Open chart in a new window
Double Bottom
was formed on 25.03 at 04:45:36 (UTC+0)
signal strength 1 of 5
The Double Bottom pattern has been formed on AUDJPY M5; the upper boundary is 94.85; the lower boundary is 94.62. The width of the pattern is 23 points. In case
The M5 and M15 time frames may have more false entry points.
Open chart in a new window