Pola sebenarnya

Bullish Symmetrical Triangle
was formed on 21.03 at 22:36:29 (UTC+0)
signal strength 1 of 5

According to the chart of M5, USDCHF formed the Bullish Symmetrical Triangle pattern. The lower border of the pattern touches the coordinates 0.8825/0.8830 whereas the upper border goes across 0.8835/0.8830. If the Bullish Symmetrical Triangle pattern is in progress, this evidently signals a further upward trend. In other words, in case the scenario comes true, the price of USDCHF will breach the upper border to head for 0.8845.
The M5 and M15 time frames may have more false entry points.
Lihat juga
- All
- All
- Bearish Rectangle
- Bearish Symmetrical Triangle
- Bearish Symmetrical Triangle
- Bullish Rectangle
- Double Top
- Double Top
- Triple Bottom
- Triple Bottom
- Triple Top
- Triple Top
- All
- All
- Buy
- Sale
- All
- 1
- 2
- 3
- 4
- 5
Teratas Ganda
was formed on 25.03 at 04:00:34 (UTC+0)
signal strength 2 of 5
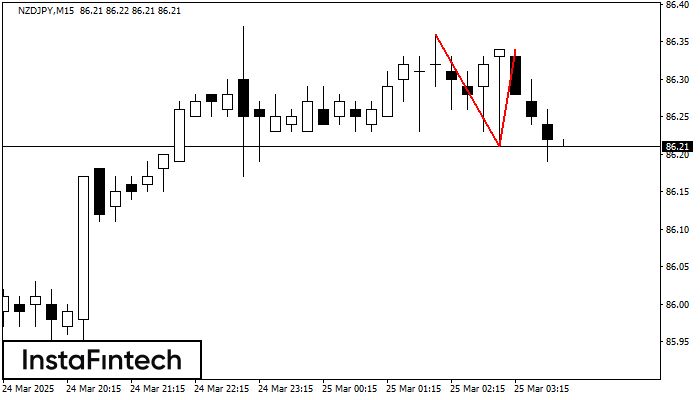
Pada grafik NZDJPY M15 pola reversal Teratas Ganda telah terbentuk. Karakteristik: batas atas 86.34; batas bawah 86.21; lebar pola 13 poin. Sinyal: tembusan ke batas bawah akan menyebabkan kelanjutan tren
Rangka waktu M5 dan M15 mungkin memiliki lebih dari titik entri yang keliru.
Open chart in a new window
Teratas Triple
was formed on 25.03 at 03:55:23 (UTC+0)
signal strength 1 of 5
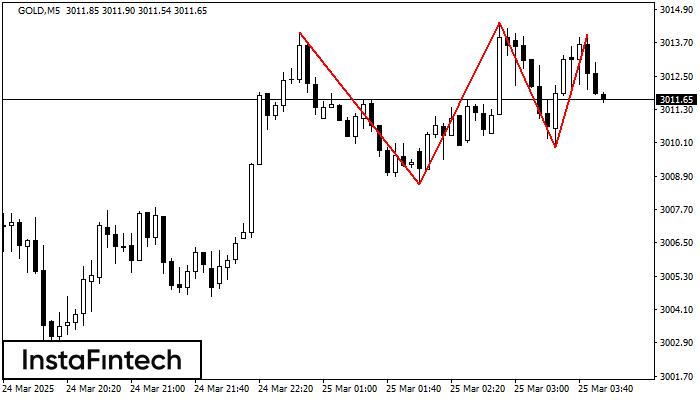
Pada grafik instrumen trading GOLD M5, pola Teratas Triple yang menandakan perubahan trend telah terbentuk. Ada kemungkinan bahwa setelah pembentukan puncak (peak) ketiga, harga akan mencoba untuk menembus level resistance
Rangka waktu M5 dan M15 mungkin memiliki lebih dari titik entri yang keliru.
Open chart in a new window
Kepala dan bahu
was formed on 25.03 at 03:30:30 (UTC+0)
signal strength 2 of 5

#Bitcoin M15 membentuk pola Kepala dan bahu dengan beberapa fitur berikut: puncak The Head di 88742.88, the Neckline dan sudut atas berada di 87100.22/87010.53. Formasi pola ini dapat membawa perubahan
Rangka waktu M5 dan M15 mungkin memiliki lebih dari titik entri yang keliru.
Open chart in a new window