Pola sebenarnya

Double Bottom
was formed on 30.03 at 14:25:09 (UTC+0)
signal strength 1 of 5
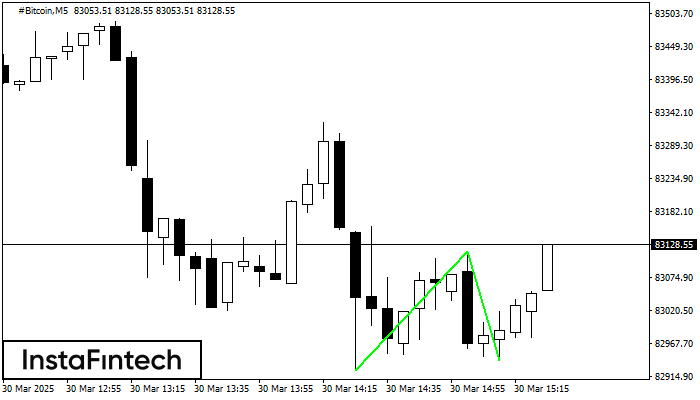
The Double Bottom pattern has been formed on #Bitcoin M5. This formation signals a reversal of the trend from downwards to upwards. The signal is that a buy trade should be opened after the upper boundary of the pattern 83117.65 is broken. The further movements will rely on the width of the current pattern 19331 points.
The M5 and M15 time frames may have more false entry points.
Lihat juga
- All
- All
- Bearish Rectangle
- Bearish Symmetrical Triangle
- Bearish Symmetrical Triangle
- Bullish Rectangle
- Double Top
- Double Top
- Triple Bottom
- Triple Bottom
- Triple Top
- Triple Top
- All
- All
- Buy
- Sale
- All
- 1
- 2
- 3
- 4
- 5
Teratas Ganda
was formed on 02.04 at 04:20:22 (UTC+0)
signal strength 1 of 5
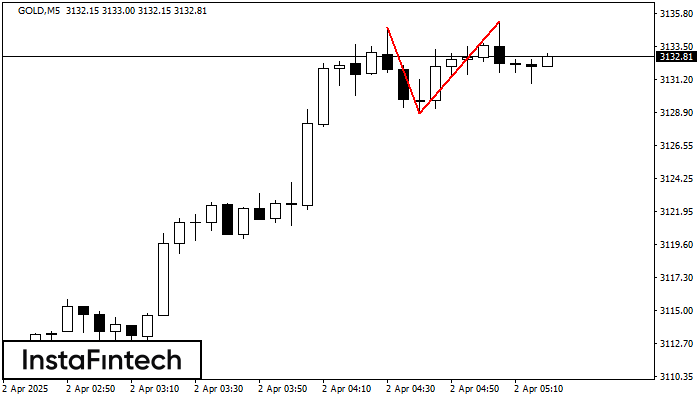
Pada grafik GOLD M5 pola reversal Teratas Ganda telah terbentuk. Karakteristik: batas atas 3135.25; batas bawah 3128.79; lebar pola 646 poin. Sinyal: tembusan ke batas bawah akan menyebabkan kelanjutan tren
Rangka waktu M5 dan M15 mungkin memiliki lebih dari titik entri yang keliru.
Open chart in a new window
Bendera Bullish
was formed on 02.04 at 04:20:19 (UTC+0)
signal strength 1 of 5
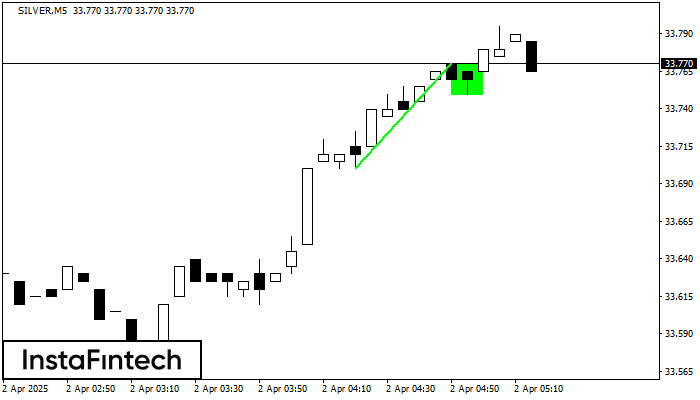
Pola Bendera Bullish telah terbentuk di grafik SILVER M5, yang memberikan sinyal tren naik akan berlanjut. Sinyal: penembusan titik puncak di 33.77 mungkin mendorong harga lebih tinggi, dan kenaikan akan
Rangka waktu M5 dan M15 mungkin memiliki lebih dari titik entri yang keliru.
Open chart in a new window
Bawah Triple
was formed on 02.04 at 04:15:26 (UTC+0)
signal strength 2 of 5
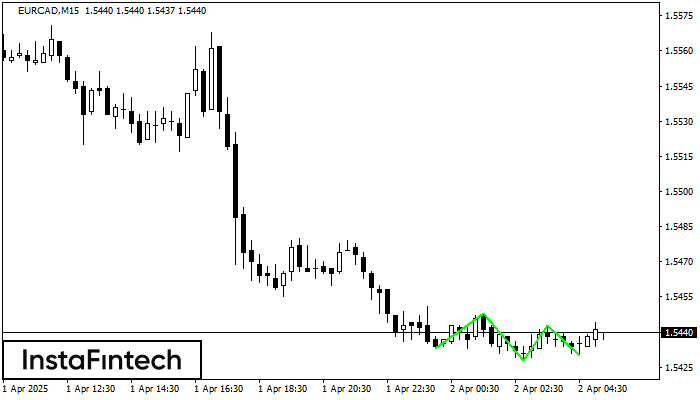
Pola Bawah Triple telah terbentuk pada grafik instrumen trading EURCAD M15. Pola tersebut menandakan perubahan dalam trend dari menurun menjadi naik jika terjadi pemecahan (breakdown) 1.5448/1.5443
Rangka waktu M5 dan M15 mungkin memiliki lebih dari titik entri yang keliru.
Open chart in a new window