Pola sebenarnya

Triple Bottom
was formed on 04.04 at 19:40:28 (UTC+0)
signal strength 1 of 5
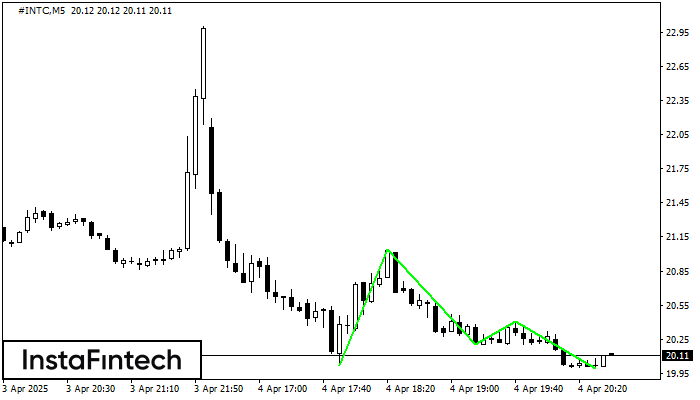
The Triple Bottom pattern has formed on the chart of #INTC M5. Features of the pattern: The lower line of the pattern has coordinates 21.04 with the upper limit 21.04/20.41, the projection of the width is 102 points. The formation of the Triple Bottom pattern most likely indicates a change in the trend from downward to upward. This means that in the event of a breakdown of the resistance level 20.02, the price is most likely to continue the upward movement.
The M5 and M15 time frames may have more false entry points.
Lihat juga
- All
- All
- Bearish Rectangle
- Bearish Symmetrical Triangle
- Bearish Symmetrical Triangle
- Bullish Rectangle
- Double Top
- Double Top
- Triple Bottom
- Triple Bottom
- Triple Top
- Triple Top
- All
- All
- Buy
- Sale
- All
- 1
- 2
- 3
- 4
- 5
बियरिश फ्लैग
was formed on 14.04 at 20:47:04 (UTC+0)
signal strength 3 of 5

बियरिश फ्लैग पैटर्न EURJPY पर M30 पर बना है। पैटर्न की निचली सीमा 162.05/162.27 पर स्थित है जबकि ऊपरी सीमा 162.33/162.55 पर स्थित है। फ्लैगपोल का प्रक्षेपण 88 पॉइंट्स है।
Open chart in a new window
बुलिश फ्लैग
was formed on 28.03 at 01:00:48 (UTC+0)
signal strength 3 of 5
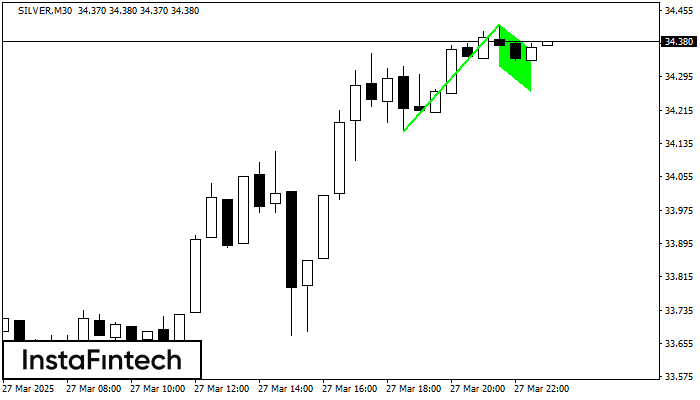
बुलिश फ्लैग पैटर्न SILVER पर M30 पर बना है। पैटर्न की निचली सीमा 34.32/34.26 पर स्थित है, जबकि उच्च सीमा 34.42/34.36 पर स्थित है। फ्लैगपोल का प्रक्षेपण 255 पॉइंट्स
Open chart in a new window
बुलिश फ्लैग
was formed on 10.03 at 13:49:20 (UTC+0)
signal strength 3 of 5
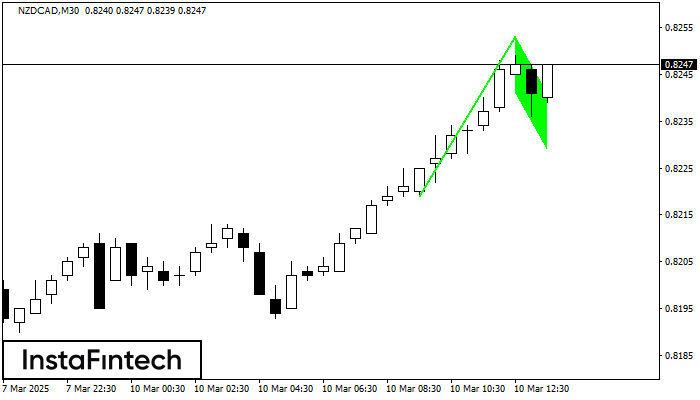
बुलिश फ्लैग पैटर्न NZDCAD M30 चार्ट पर बनाया गया है जो दर्शाता है कि ऊपर की ओर रुझान जारी रहेगा। संकेत: 0.8253 पर शिखर के टूटने से कीमत अधिक हो
Open chart in a new window