यह भी देखें


 27.12.2023 03:07 PM
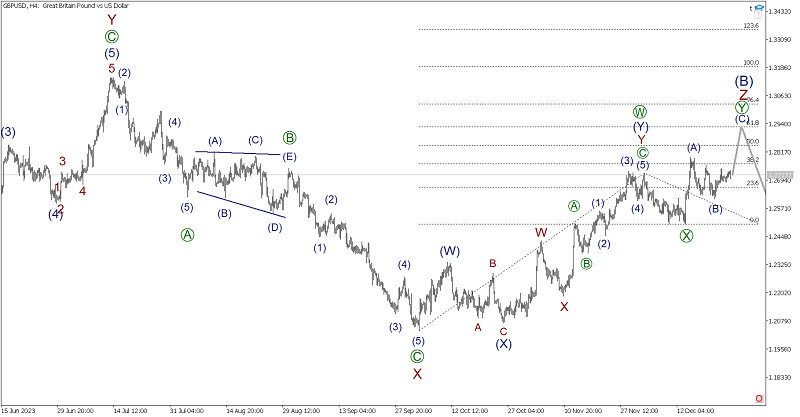
In the current analysis, GBP/USD is undergoing the construction of an upward active wave Z from the perspective of wave analysis. It has a complex internal structure in the form of a double zigzag [W]-[X]-[Y]. It is possible that the first active wave [W] has been fully completed. Additionally, a downward combination wave [X] could also be constructed.
Thus, in the recent segment of the chart, we can observe the development of a bullish active wave [Y], which may take the form of a standard zigzag (A)-(B)-(C). The first impulse wave (A) has already been completed, and a bearish correction (B) to it has also been constructed. Soon, market participants can expect a price rise in the final impulse wave (C).
As of today, there are no significant news events that would impact the market. Therefore, nothing prevents the current forecast from materializing. Opening long positions with the target of taking profit at the end of the impulse (C) can be considered.
The end of wave [Y] is determined using the Fibonacci expansion tool. At the level of 1.2940, the magnitude of wave [Y] will be 61.8% of [W].
Trading recommendations: Buy at 1.2717, take profit at 1.2940.
You have already liked this post today
*यहां पर लिखा गया बाजार विश्लेषण आपकी जागरूकता बढ़ाने के लिए किया है, लेकिन व्यापार करने के लिए निर्देश देने के लिए नहीं |
आने वाले दिनों में यूरो विनिमय दर में गिरावट का दौर पूरा होने की संभावना है, जो संभावित रूप से गणना किए गए समर्थन क्षेत्र की निचली सीमा तक पहुंच
विश्लेषण: फरवरी की शुरुआत से ही, यूरो एक ऊपर की ओर टेढ़ी-मेढ़ी लहर बना रहा है, जो एक नए तेजी के रुझान की शुरुआत को दर्शाता है। यह जोड़ी साप्ताहिक
विश्लेषण: 13 जनवरी को शुरू हुई ऊपर की लहर अभी भी अधूरी है, जो प्रमुख वैश्विक अपट्रेंड का एक नया खंड बनाती है। यह जोड़ी वर्तमान में समर्थन और प्रतिरोध
पिछले छह महीनों में, GBP/USD में गिरावट का रुख रहा है। जनवरी के मध्य से, कीमत एक मजबूत समर्थन क्षेत्र से उलटफेर की संभावना के साथ एक काउंटर-वेव बना रही
ब्रिटिश पाउंड के लिए प्रमुख मंदी की लहर, जो पिछले साल अगस्त में शुरू हुई थी, दो सप्ताह पहले शुरू हुए सुधारात्मक, बदलते फ्लैट पैटर्न के माध्यम से विकसित होना
विश्लेषण: पिछले साल अक्टूबर से, यूरो की कीमत में उतार-चढ़ाव की लहर चल रही है। साल की शुरुआत से ही एक काउंटर-करेक्शन बन रहा है, जो एक विस्तारित फ्लैट पैटर्न
GBP/USD विश्लेषण: पिछले साल अगस्त से, GBP/USD चार्ट को नीचे की ओर लहर द्वारा परिभाषित किया गया है। 13 जनवरी से, प्राथमिक प्रवृत्ति के विरुद्ध एक काउंटर-करेक्शन बना है, जो
विश्लेषण: पिछले साल अगस्त से, प्रमुख EUR/USD जोड़ी एक प्रमुख डाउनट्रेंड में रही है। कीमत में गिरावट ने संभावित बड़े पैमाने पर उलटफेर क्षेत्र की ऊपरी सीमा पर उद्धरण लाए।
Your IP address shows that you are currently located in the USA. If you are a resident of the United States, you are prohibited from using the services of InstaFintech Group including online trading, online transfers, deposit/withdrawal of funds, etc.
If you think you are seeing this message by mistake and your location is not the US, kindly proceed to the website. Otherwise, you must leave the website in order to comply with government restrictions.
Why does your IP address show your location as the USA?
Please confirm whether you are a US resident or not by clicking the relevant button below. If you choose the wrong option, being a US resident, you will not be able to open an account with InstaTrade anyway.
We are sorry for any inconvenience caused by this message.

