यह भी देखें

On Thursday, the market may continue moving downward from 1.0886 (yesterday's daily close) toward 1.0861 – the 14.6% Fibonacci retracement level (blue dashed line). From this level, a rebound upward toward 1.0897 – the upper fractal (blue dashed line) – is possible.
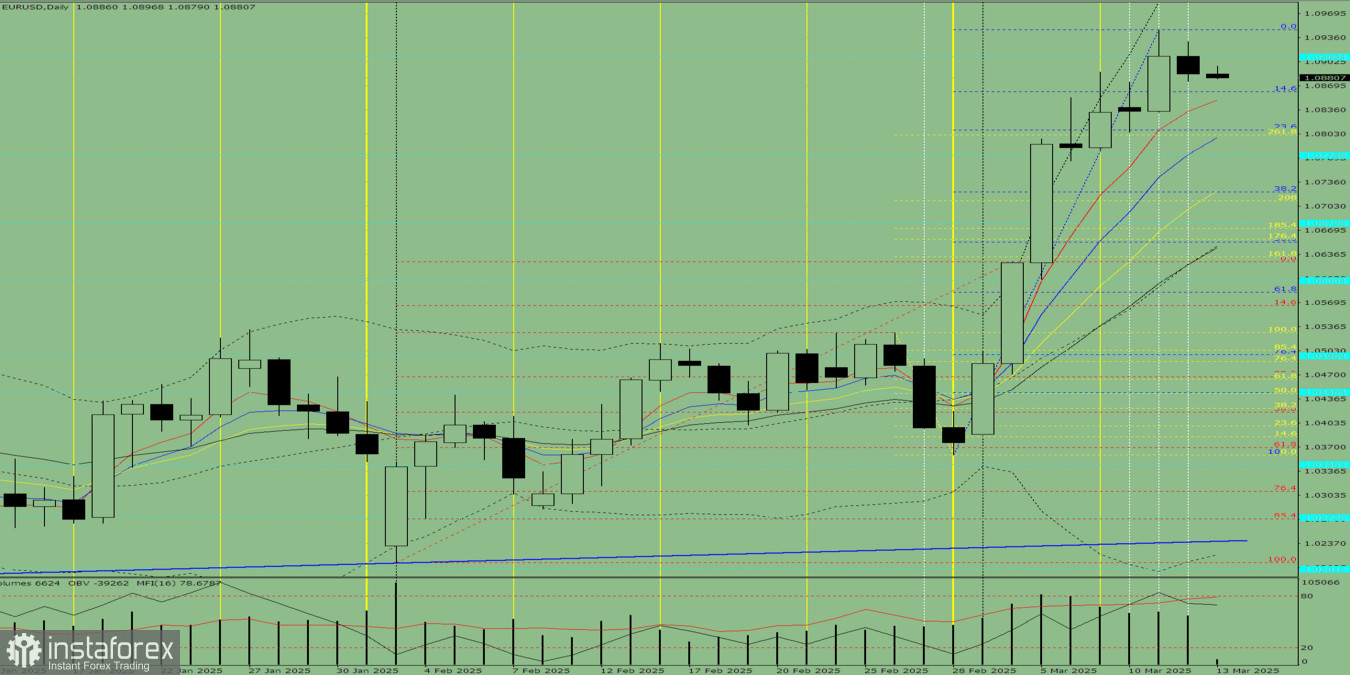
On Thursday, the market may continue declining from 1.0886 (yesterday's daily close) toward 1.0808 – the 23.6% Fibonacci retracement level (blue dashed line). From this level, the price may rebound upward toward 1.0861 – the 14.6% Fibonacci retracement level (blue dashed line).
You have already liked this post today
*यहां पर लिखा गया बाजार विश्लेषण आपकी जागरूकता बढ़ाने के लिए किया है, लेकिन व्यापार करने के लिए निर्देश देने के लिए नहीं |


