वास्तविक पैटर्न

पैटर्न ग्राफिकल मॉडल हैं जो चार्ट में मूल्य से बने होते हैं। तकनीकी विश्लेषण भविष्यवाणियों में से एक के अनुसार, इतिहास का मतलब मूल्य आंदोलन खुद को दोहराता है। इसका मतलब है कि मूल्य आंदोलन अक्सर एक ही परिस्थितियों में समान होते हैं जो उच्च संभावना के साथ स्थिति के आगे के विकास की भविष्यवाणी करना संभव बनाता है।
इंस्टा फॉरेक्स द्वारा प्रासंगिक पैटर्न एक उपयोग में आसान सेवा है जो आपको बाजार में नवीनतम परिवर्तनों के बारे में जागरूक होने और समय पर बाजार से संकेतों पर प्रतिक्रिया करने की अनुमति देती है। हमारी सेवा में आप हमेशा किसी भी जोड़ी और किसी भी समय सीमा पर नवीनतम और सबसे प्रासंगिक पैटर्न प्राप्त कर सकते हैं.
Triple Top
was formed on 21.03 at 20:36:09 (UTC+0)
signal strength 1 of 5
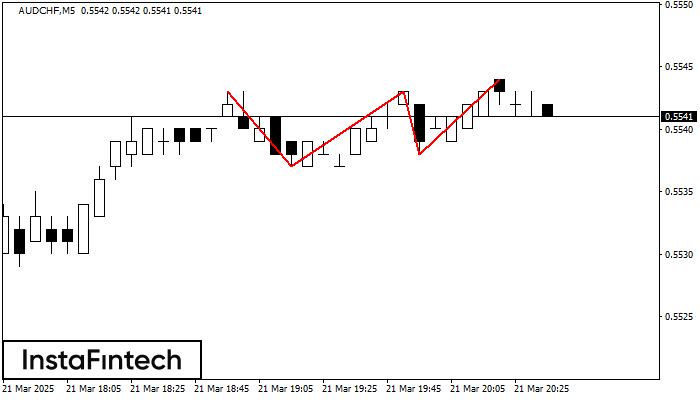
The Triple Top pattern has formed on the chart of the AUDCHF M5 trading instrument. It is a reversal pattern featuring the following characteristics: resistance level -1, support level -1, and pattern’s width 6. Forecast If the price breaks through the support level 0.5537, it is likely to move further down to 0.5528.
The M5 and M15 time frames may have more false entry points.
See Also
- All
- All
- Bearish Rectangle
- Bearish Symmetrical Triangle
- Bearish Symmetrical Triangle
- Bullish Rectangle
- Double Top
- Double Top
- Triple Bottom
- Triple Bottom
- Triple Top
- Triple Top
- All
- All
- Buy
- Sale
- All
- 1
- 2
- 3
- 4
- 5
बुलिश सिमेट्रिकल त्रिभुज
was formed on 25.03 at 05:33:06 (UTC+0)
signal strength 1 of 5

M5 के चार्ट के अनुसार, USDJPY से बुलिश सिमेट्रिकल त्रिभुज पैटर्न बना, जो दर्शाता है कि ट्रेंड जारी रहेगा। विवरण: पैटर्न की ऊपरी सीमा निर्देशांक 150.95/150.72 को स्पर्श करती है
M5 और M15 समय सीमा में अधिक फाल्स एंट्री पॉइंट्स हो सकते हैं।
Open chart in a new window
हेड एण्ड शोल्डर्स
was formed on 25.03 at 04:50:35 (UTC+0)
signal strength 1 of 5

हेड एण्ड शोल्डर्स नामक तकनीकी पैटर्न AUDJPY M5 के चार्ट पर प्रदर्शित हुआ है। वजनदार कारणों से यह सुझाव दिया जाता है कि दाहिना शोल्डर बनने के बाद कीमत नेकलाइन
M5 और M15 समय सीमा में अधिक फाल्स एंट्री पॉइंट्स हो सकते हैं।
Open chart in a new window
डबल बॉटम
was formed on 25.03 at 04:45:36 (UTC+0)
signal strength 1 of 5
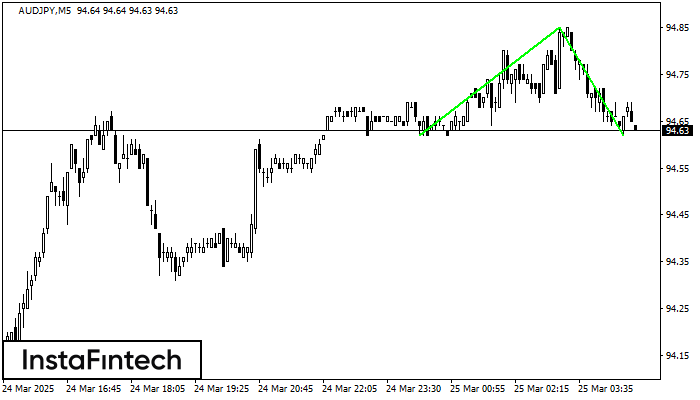
डबल बॉटम पैटर्न AUDJPY M5 पर बना है; ऊपरी सीमा 94.85 है; निचली सीमा 94.62 है। पैटर्न की चौड़ाई 23 अंक है। ऊपरी सीमा 94.85 के टूटने के मामले में
M5 और M15 समय सीमा में अधिक फाल्स एंट्री पॉइंट्स हो सकते हैं।
Open chart in a new window