वास्तविक पैटर्न

पैटर्न ग्राफिकल मॉडल हैं जो चार्ट में मूल्य से बने होते हैं। तकनीकी विश्लेषण भविष्यवाणियों में से एक के अनुसार, इतिहास का मतलब मूल्य आंदोलन खुद को दोहराता है। इसका मतलब है कि मूल्य आंदोलन अक्सर एक ही परिस्थितियों में समान होते हैं जो उच्च संभावना के साथ स्थिति के आगे के विकास की भविष्यवाणी करना संभव बनाता है।
इंस्टा फॉरेक्स द्वारा प्रासंगिक पैटर्न एक उपयोग में आसान सेवा है जो आपको बाजार में नवीनतम परिवर्तनों के बारे में जागरूक होने और समय पर बाजार से संकेतों पर प्रतिक्रिया करने की अनुमति देती है। हमारी सेवा में आप हमेशा किसी भी जोड़ी और किसी भी समय सीमा पर नवीनतम और सबसे प्रासंगिक पैटर्न प्राप्त कर सकते हैं.
Bullish Rectangle
was formed on 27.03 at 22:46:39 (UTC+0)
signal strength 2 of 5
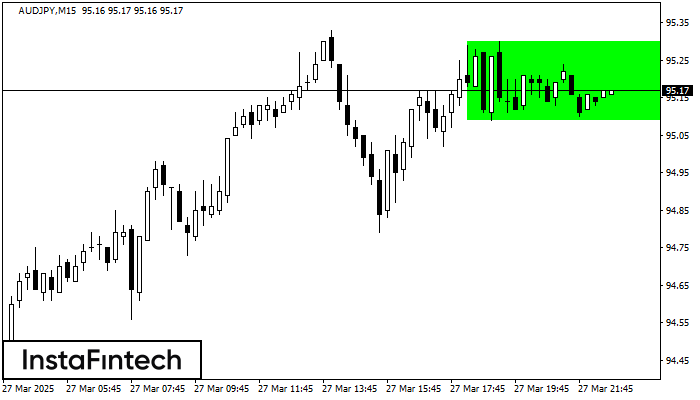
According to the chart of M15, AUDJPY formed the Bullish Rectangle. The pattern indicates a trend continuation. The upper border is 95.30, the lower border is 95.09. The signal means that a long position should be opened above the upper border 95.30 of the Bullish Rectangle.
The M5 and M15 time frames may have more false entry points.
See Also
- All
- All
- Bearish Rectangle
- Bearish Symmetrical Triangle
- Bearish Symmetrical Triangle
- Bullish Rectangle
- Double Top
- Double Top
- Triple Bottom
- Triple Bottom
- Triple Top
- Triple Top
- All
- All
- Buy
- Sale
- All
- 1
- 2
- 3
- 4
- 5
Double Top
was formed on 14.04 at 02:30:27 (UTC+0)
signal strength 2 of 5
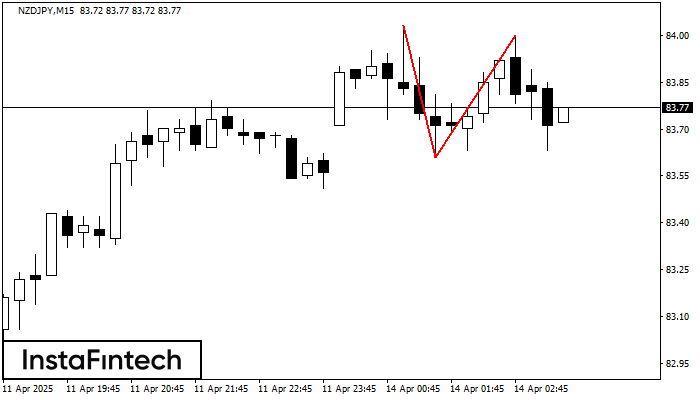
The Double Top reversal pattern has been formed on NZDJPY M15. Characteristics: the upper boundary 84.03; the lower boundary 83.61; the width of the pattern is 39 points. Sell trades
The M5 and M15 time frames may have more false entry points.
Open chart in a new window
Double Top
was formed on 14.04 at 02:00:14 (UTC+0)
signal strength 1 of 5
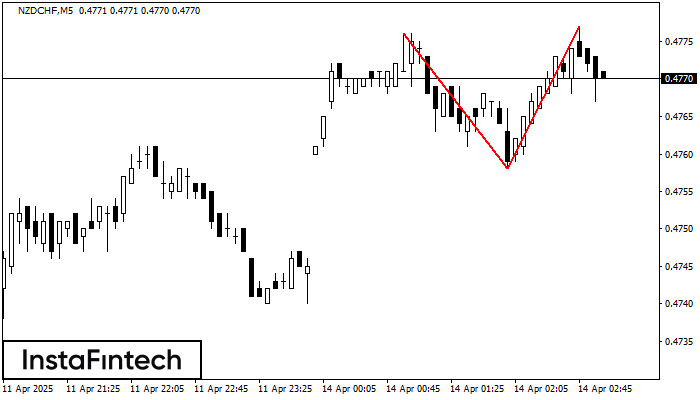
The Double Top reversal pattern has been formed on NZDCHF M5. Characteristics: the upper boundary 0.4776; the lower boundary 0.4758; the width of the pattern is 19 points. Sell trades
The M5 and M15 time frames may have more false entry points.
Open chart in a new window
Bullish pennant
was formed on 14.04 at 01:45:23 (UTC+0)
signal strength 2 of 5
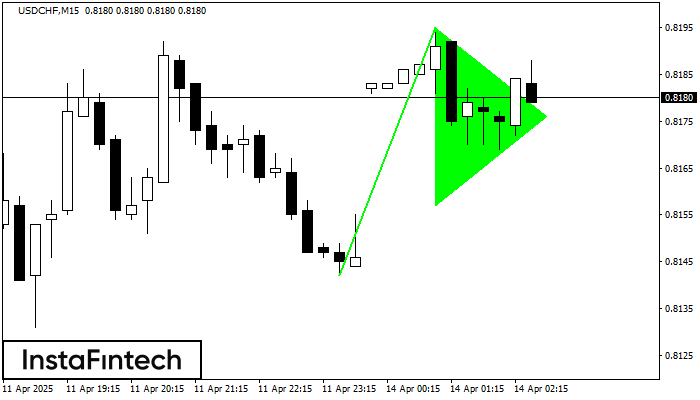
The Bullish pennant signal – Trading instrument USDCHF M15, continuation pattern. Forecast: it is possible to set up a buy position above the pattern’s high of 0.8195, with the prospect
The M5 and M15 time frames may have more false entry points.
Open chart in a new window