Өзекті паттерндер

Двойная вершина
сформирован 07.04 в 02:00:14 (UTC+0)
сила сигнала 1 из 5
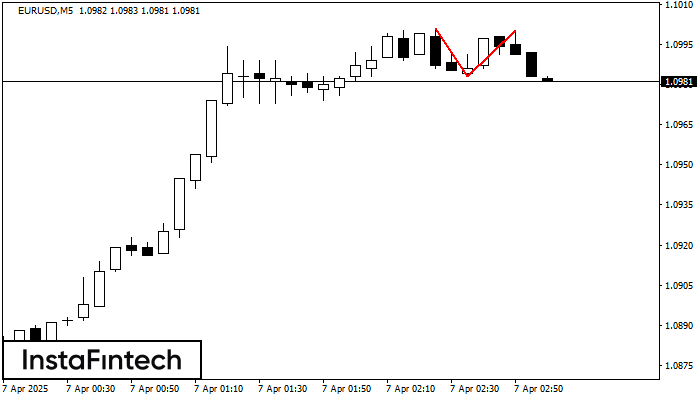
На торговом графике EURUSD M5 сформировалась разворотная фигура «Двойная вершина». Характеристика: Верхняя граница 1.1000; Нижняя граница 1.0983; Ширина фигуры 17 пунктов. Сигнал: Пробой нижней границы 1.0983 приведет к дальнейшему нисходящему движению с перспективой хода к уровню 1.0968.
Таймфреймы М5 и М15 могут иметь больше ложных точек входа.
- Все
- Все
- Bearish Rectangle
- Bearish Symmetrical Triangle
- Bearish Symmetrical Triangle
- Bullish Rectangle
- Double Top
- Double Top
- Triple Bottom
- Triple Bottom
- Triple Top
- Triple Top
- Все
- Все
- Покупка
- Продажа
- Все
- 1
- 2
- 3
- 4
- 5
Double Top
сформирован 21.04 в 05:30:19 (UTC+0)
сила сигнала 1 из 5
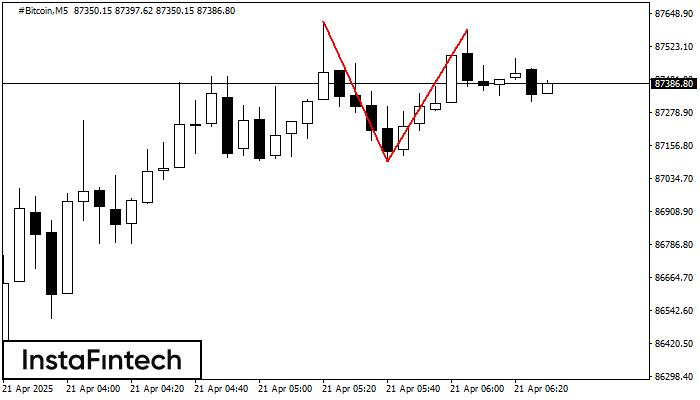
The Double Top reversal pattern has been formed on #Bitcoin M5. Characteristics: the upper boundary 87617.56; the lower boundary 87098.24; the width of the pattern is 48893 points. Sell trades
The M5 and M15 time frames may have more false entry points.
Открыть график инструмента в новом окне
Bullish Symmetrical Triangle
сформирован 21.04 в 04:56:25 (UTC+0)
сила сигнала 1 из 5

According to the chart of M5, AUDCAD formed the Bullish Symmetrical Triangle pattern, which signals the trend will continue. Description. The upper border of the pattern touches the coordinates 0.8838/0.8828
The M5 and M15 time frames may have more false entry points.
Открыть график инструмента в новом окне
Bullish pennant
сформирован 21.04 в 04:53:32 (UTC+0)
сила сигнала 1 из 5

The Bullish pennant graphic pattern has formed on the GBPAUD M5 instrument. This pattern type falls under the category of continuation patterns. In this case, if the quote can breaks
The M5 and M15 time frames may have more false entry points.
Открыть график инструмента в новом окне