Өзекті паттерндер

Бычий симметричный треугольник
сформирован 08.04 в 14:47:55 (UTC+0)
сила сигнала 3 из 5
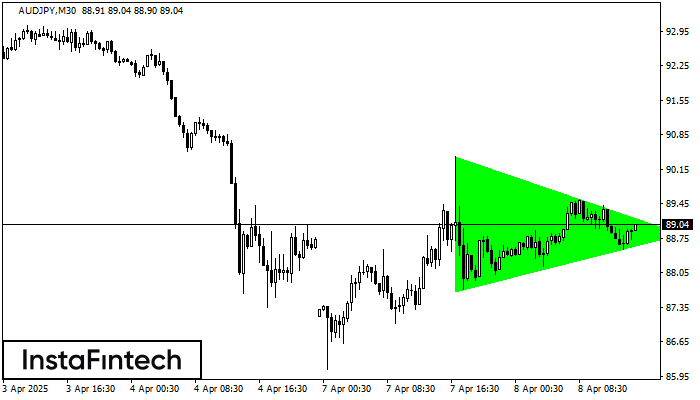
По AUDJPY на M30 фигура «Бычий симметричный треугольник». Характеристика: Фигура продолжения тренда; Координаты границ – верхняя 90.41, нижняя 87.68. Проекция ширины фигуры 273 пунктов. Прогноз: В случае пробоя верхней границы 90.41 цена, вероятнее всего, продолжит движение к 89.12.
- Все
- Все
- Bearish Rectangle
- Bearish Symmetrical Triangle
- Bearish Symmetrical Triangle
- Bullish Rectangle
- Double Top
- Double Top
- Triple Bottom
- Triple Bottom
- Triple Top
- Triple Top
- Все
- Все
- Покупка
- Продажа
- Все
- 1
- 2
- 3
- 4
- 5
Bearish Rectangle
was formed on 20.04 at 19:17:25 (UTC+0)
signal strength 1 of 5

According to the chart of M5, #Bitcoin formed the Bearish Rectangle which is a pattern of a trend continuation. The pattern is contained within the following borders: lower border 84213.45
The M5 and M15 time frames may have more false entry points.
Open chart in a new window
Double Bottom
was formed on 20.04 at 18:15:23 (UTC+0)
signal strength 1 of 5

The Double Bottom pattern has been formed on #Bitcoin M5; the upper boundary is 84636.40; the lower boundary is 84234.35. The width of the pattern is 42295 points. In case
The M5 and M15 time frames may have more false entry points.
Open chart in a new window
Double Top
was formed on 20.04 at 00:11:29 (UTC+0)
signal strength 1 of 5

The Double Top pattern has been formed on #Bitcoin M5. It signals that the trend has been changed from upwards to downwards. Probably, if the base of the pattern 85200.45
The M5 and M15 time frames may have more false entry points.
Open chart in a new window