Lihat juga


 02.09.2024 10:23 AM
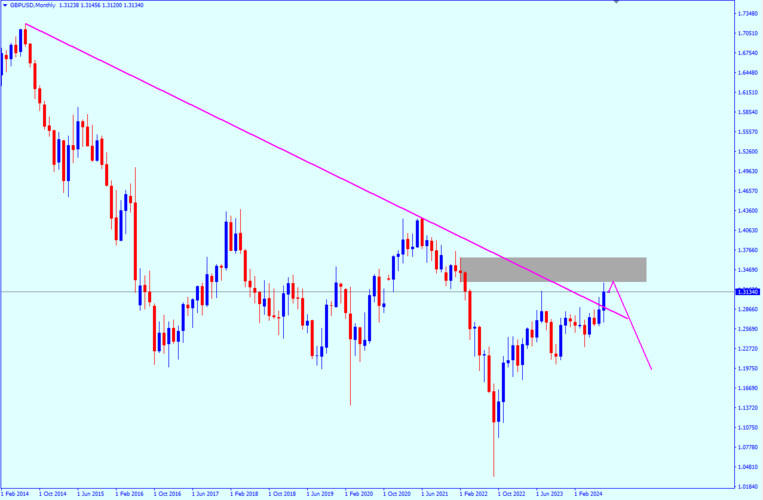
Monthly chart
In the monthly time frame, the GBP/USD pair broke a downtrend line that lasted for more than 10 years. However, this break could be false and GBP/USD will not be able to continue rising after this break. It is targeting liquidity above the trend line and will rebound from the order zone at 1.3280. From this area, we may see some bearish signals such as price action or a bearish structure.
Weekly chart
The weekly time frame also supports the decline because the trend is still bearish and there is an additional signal that supports the decline from the order block of 1.3488, which is the presence of an IDM before this level. The IDM is like liquidity that attracts traders to enter from areas before the real bounce happens, and the GBP/USD pair will target breaking the internal upward trend.
Daily chart
There are not many opportunities in the daily time frame, but there is a liquidity void, which is a sign that the pair needs to make some corrections before continuing the rise. This is actually a good sign to target the order block on the weekly time frame. To reach that order block, the instrument will bounce from 1.2871 (order block) or from the 61.8 Fibonacci level. These are considered important levels for the bounce, and then we will see a strong rise after that.
4-hour chart
If you want to enter a trade until the price reaches the appropriate areas in the daily time frame, there is a good area to enter sell from the level of 1.31642. This area is considered an order flow zone, as the price bounced from the order block above it, and then I expect it to do the same thing from this zone, especially since a Shift in Structure occurred. This is a good signal for the start of the downward trend in the four hours.
Points of interest (POI)
Sell from: 1.31642 (from OB with the Order flow)
TP 1: 1.30537 (maybe will rebound from there)
TP 2: 1.2900 (will continue the bullish movements in the daily)
Stop loss: 1.3200 (above the OB)
You have already liked this post today
* Analisis pasaran yang disiarkan di sini adalah bertujuan untuk meningkatkan kesedaran anda, tetapi tidak untuk memberi arahan untuk membuat perdagangan.
Analisis Dagangan dan Petua Dagangan untuk Yen Jepun Ujian harga pada paras 142.60 berlaku ketika penunjuk MACD telah bergerak jauh di atas paras sifar, yang pada pandangan saya telah mengehadkan
Analisis Dagangan dan Petua Dagangan untuk Pound British Ujian harga pada paras 1.3322 berlaku apabila penunjuk MACD telah bergerak jauh di atas garisan sifar, sekali gus mengehadkan potensi kenaikan pasangan
Analisis Dagangan dan Petua Dagangan untuk Euro Ujian pertama pada aras harga 1.1372 pada separuh kedua hari berlaku apabila penunjuk MACD sudah pun bergerak jauh di bawah paras sifar, yang
EUR dan GBP berjaya bertahan daripada tekanan semalam, namun hari ini penurunan dalam aset berisiko yang digandingkan dengan dolar terus berlanjutan. Data yang diterbitkan mengenai pasaran buruh AS serta angka
Analisis Perdagangan dan Tip Strategi untuk Yen Jepun Ujian pertama pada tahap 142.66 berlaku apabila penunjuk MACD telah jatuh dengan ketara di bawah garisan sifar, yang menghadkan potensi penurunan pasangan
Analisis Dagangan dan Tip Berdagang Pound Britain Ujian pada tahap 1.3286 berlaku apabila penunjuk MACD sudah bergerak jauh melepasi paras sifar, yang pada pendapat saya, mengehadkan potensi kenaikan pound. Oleh
Ulasan Perdagangan dan Tip untuk Berdagang Euro Ujian bagi tahap 1.1361 berlaku apabila penunjuk MACD telah bergerak jauh di atas paras sifar, yang mengehadkan potensi kenaikan bagi pasangan mata wang
Analisis Dagangan dan Petua Dagangan untuk Yen Jepun Ujian pada paras 142.32 berlaku apabila penunjuk MACD telah pun bergerak jauh melepasi paras sifar, yang pada pandangan saya, telah mengehadkan potensi
Analisis Dagangan dan Petua Dagangan untuk Euro Ujian harga pada paras 1.1382 pada separuh kedua hari ini bertepatan dengan penunjuk MACD yang mula bergerak ke bawah dari garis sifar, sekali
Analisis Dagangan dan Petua Dagangan untuk Pound British Ujian harga pada paras 1.3285 berlaku apabila penunjuk MACD baru sahaja mula bergerak menurun dari paras sifar, sekali gus mengesahkan titik masuk
Your IP address shows that you are currently located in the USA. If you are a resident of the United States, you are prohibited from using the services of InstaFintech Group including online trading, online transfers, deposit/withdrawal of funds, etc.
If you think you are seeing this message by mistake and your location is not the US, kindly proceed to the website. Otherwise, you must leave the website in order to comply with government restrictions.
Why does your IP address show your location as the USA?
Please confirm whether you are a US resident or not by clicking the relevant button below. If you choose the wrong option, being a US resident, you will not be able to open an account with InstaTrade anyway.
We are sorry for any inconvenience caused by this message.

