Corak sebenar

Triple Top
was formed on 18.03 at 15:34:35 (UTC+0)
signal strength 1 of 5
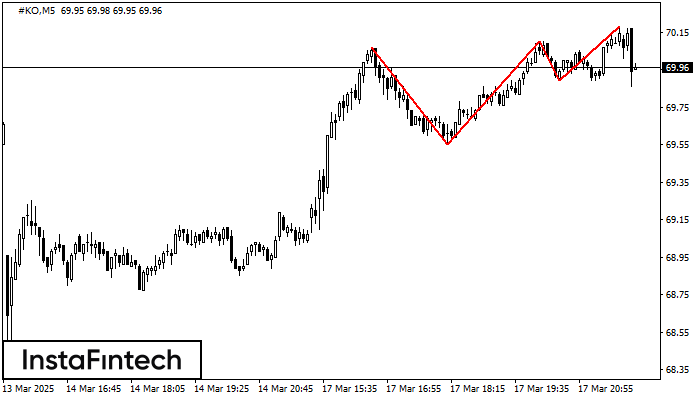
The Triple Top pattern has formed on the chart of the #KO M5 trading instrument. It is a reversal pattern featuring the following characteristics: resistance level -11, support level -34, and pattern’s width 52. Forecast If the price breaks through the support level 69.55, it is likely to move further down to 69.95.
The M5 and M15 time frames may have more false entry points.
Juga lihat
- All
- All
- Bearish Rectangle
- Bearish Symmetrical Triangle
- Bearish Symmetrical Triangle
- Bullish Rectangle
- Double Top
- Double Top
- Triple Bottom
- Triple Bottom
- Triple Top
- Triple Top
- All
- All
- Buy
- Sale
- All
- 1
- 2
- 3
- 4
- 5
Bullish Symmetrical Triangle
was formed on 21.03 at 20:20:31 (UTC+0)
signal strength 1 of 5

According to the chart of M5, #GOOG formed the Bullish Symmetrical Triangle pattern, which signals the trend will continue. Description. The upper border of the pattern touches the coordinates 165.68/165.13
The M5 and M15 time frames may have more false entry points.
Open chart in a new window
Double Top
was formed on 21.03 at 20:10:26 (UTC+0)
signal strength 1 of 5
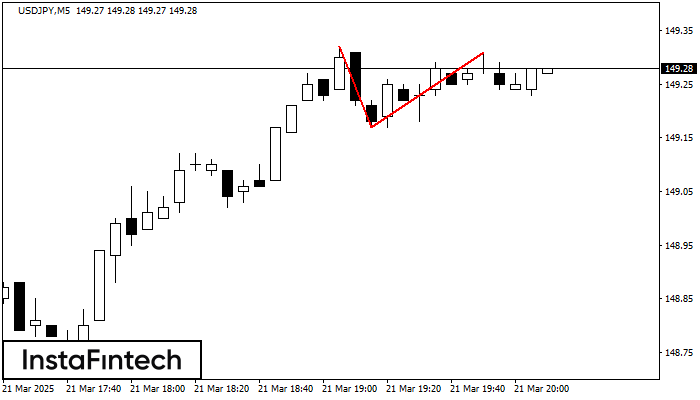
On the chart of USDJPY M5 the Double Top reversal pattern has been formed. Characteristics: the upper boundary 149.31; the lower boundary 149.17; the width of the pattern 14 points
The M5 and M15 time frames may have more false entry points.
Open chart in a new window
Double Top
was formed on 21.03 at 20:00:35 (UTC+0)
signal strength 1 of 5
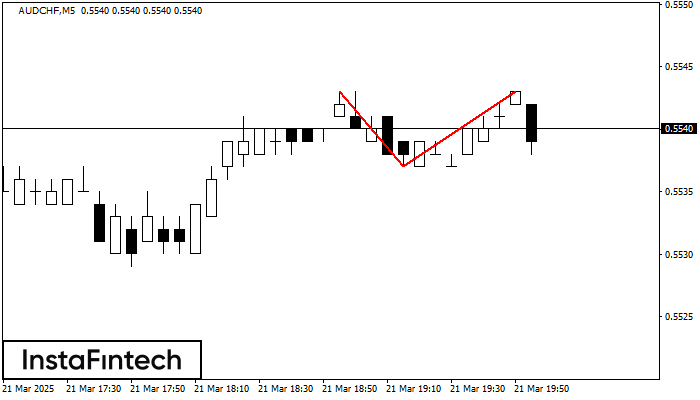
The Double Top reversal pattern has been formed on AUDCHF M5. Characteristics: the upper boundary 0.5543; the lower boundary 0.5537; the width of the pattern is 6 points. Sell trades
The M5 and M15 time frames may have more false entry points.
Open chart in a new window