Corak sebenar

Bearish Symmetrical Triangle
was formed on 18.03 at 15:34:48 (UTC+0)
signal strength 1 of 5
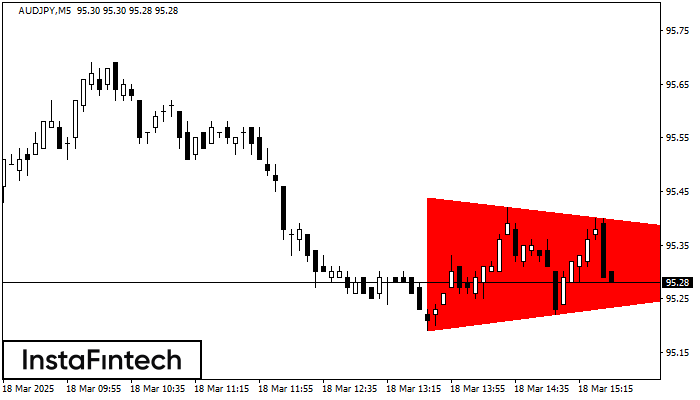
According to the chart of M5, AUDJPY formed the Bearish Symmetrical Triangle pattern. Description: The lower border is 95.19/95.32 and upper border is 95.44/95.32. The pattern width is measured on the chart at -25 pips. The formation of the Bearish Symmetrical Triangle pattern evidently signals a continuation of the downward trend. In other words, if the scenario comes true and AUDJPY breaches the lower border, the price could continue its move toward 95.17.
The M5 and M15 time frames may have more false entry points.
Juga lihat
- All
- All
- Bearish Rectangle
- Bearish Symmetrical Triangle
- Bearish Symmetrical Triangle
- Bullish Rectangle
- Double Top
- Double Top
- Triple Bottom
- Triple Bottom
- Triple Top
- Triple Top
- All
- All
- Buy
- Sale
- All
- 1
- 2
- 3
- 4
- 5
Triple Top
was formed on 21.03 at 20:36:09 (UTC+0)
signal strength 1 of 5
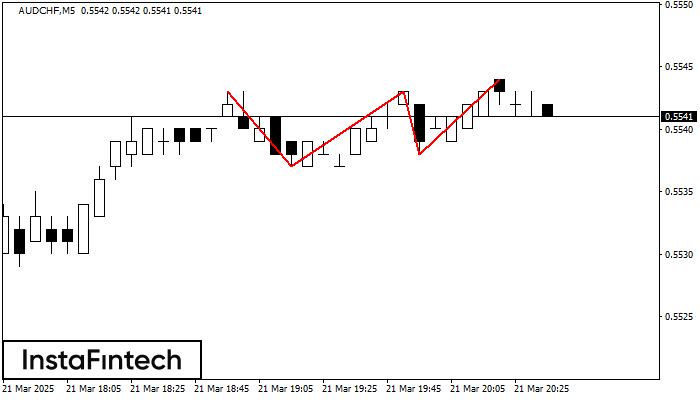
The Triple Top pattern has formed on the chart of the AUDCHF M5 trading instrument. It is a reversal pattern featuring the following characteristics: resistance level -1, support level -1
The M5 and M15 time frames may have more false entry points.
Open chart in a new window
Triple Top
was formed on 21.03 at 20:35:56 (UTC+0)
signal strength 1 of 5
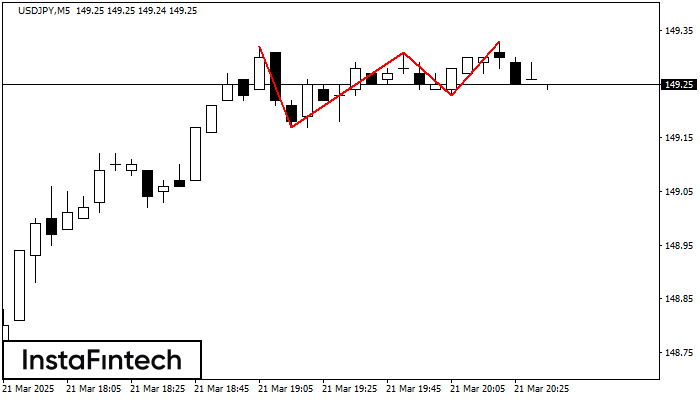
The Triple Top pattern has formed on the chart of the USDJPY M5. Features of the pattern: borders have an ascending angle; the lower line of the pattern
The M5 and M15 time frames may have more false entry points.
Open chart in a new window
Bullish Symmetrical Triangle
was formed on 21.03 at 20:20:31 (UTC+0)
signal strength 1 of 5

According to the chart of M5, #GOOG formed the Bullish Symmetrical Triangle pattern, which signals the trend will continue. Description. The upper border of the pattern touches the coordinates 165.68/165.13
The M5 and M15 time frames may have more false entry points.
Open chart in a new window