Corak sebenar

Head and Shoulders
was formed on 25.03 at 04:15:36 (UTC+0)
signal strength 1 of 5

According to the chart of M5, USDJPY formed the Head and Shoulders pattern. The Head’s top is set at 150.87 while the median line of the Neck is found at 150.68/150.70. The formation of the Head and Shoulders pattern evidently signals a reversal of the upward trend. In other words, in case the scenario comes true, the price of USDJPY will go towards 150.55.
The M5 and M15 time frames may have more false entry points.
Juga lihat
- All
- All
- Bearish Rectangle
- Bearish Symmetrical Triangle
- Bearish Symmetrical Triangle
- Bullish Rectangle
- Double Top
- Double Top
- Triple Bottom
- Triple Bottom
- Triple Top
- Triple Top
- All
- All
- Buy
- Sale
- All
- 1
- 2
- 3
- 4
- 5
Segi Tiga Simetri Menaik
was formed on 27.03 at 01:21:01 (UTC+0)
signal strength 1 of 5
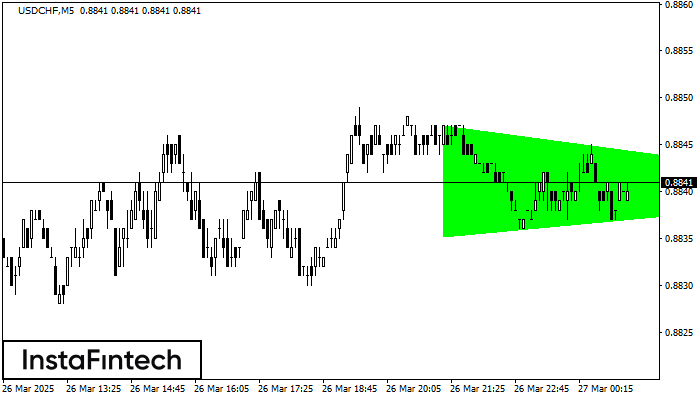
Berdasarkan carta M5, USDCHF membentuk corak Segi Tiga Simetri Menaik. Penerangan: Ini adalah corak kesinambungan aliran. 0.8847 dan 0.8835 adalah koordinat sempadan atas dan bawah masing-masing. Lebar corak diukur pada
Carta masa M5 dan M15 mungkin mempunyai lebih banyak titik kemasukan palsu.
Open chart in a new window
Double Bottom
was formed on 27.03 at 00:00:29 (UTC+0)
signal strength 3 of 5

Corak Double Bottom telah dibentuk pada NZDCAD M30; sempadan atas adalah 0.8209; sempadan bawah adalah 0.8165. Lebar corak adalah 43 mata. Sekiranya penembusan sempadan atas 0.8209, perubahan aliran boleh diramalkan
Open chart in a new window
Double Top
was formed on 27.03 at 00:00:20 (UTC+0)
signal strength 5 of 5
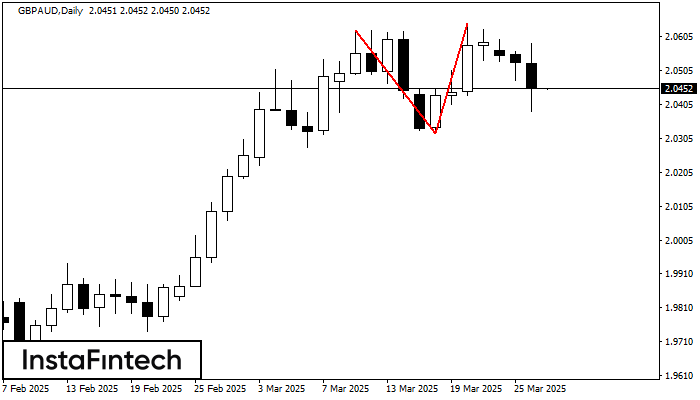
Pada carta GBPAUD D1 corak pembalikan Double Top telah terbentuk. Ciri-ciri: sempadan atas 2.0644; sempadan bawah 2.0321; lebar corak 323 mata. Isyarat: penembusan sempadan bawah akan menyebabkan kesinambungan arah aliran
Open chart in a new window