Corak sebenar

Triple Top
was formed on 25.03 at 15:55:23 (UTC+0)
signal strength 1 of 5
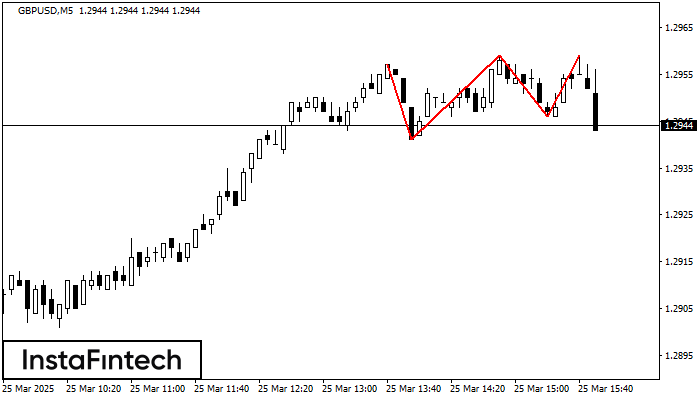
The Triple Top pattern has formed on the chart of the GBPUSD M5. Features of the pattern: borders have an ascending angle; the lower line of the pattern has the coordinates 1.2941/1.2946 with the upper limit 1.2957/1.2959; the projection of the width is 16 points. The formation of the Triple Top figure most likely indicates a change in the trend from upward to downward. This means that in the event of a breakdown of the support level of 1.2941, the price is most likely to continue the downward movement.
The M5 and M15 time frames may have more false entry points.
- All
- All
- Bearish Rectangle
- Bearish Symmetrical Triangle
- Bearish Symmetrical Triangle
- Bullish Rectangle
- Double Top
- Double Top
- Triple Bottom
- Triple Bottom
- Triple Top
- Triple Top
- All
- All
- Buy
- Sale
- All
- 1
- 2
- 3
- 4
- 5
Double Top
was formed on 31.03 at 18:31:19 (UTC+0)
signal strength 1 of 5
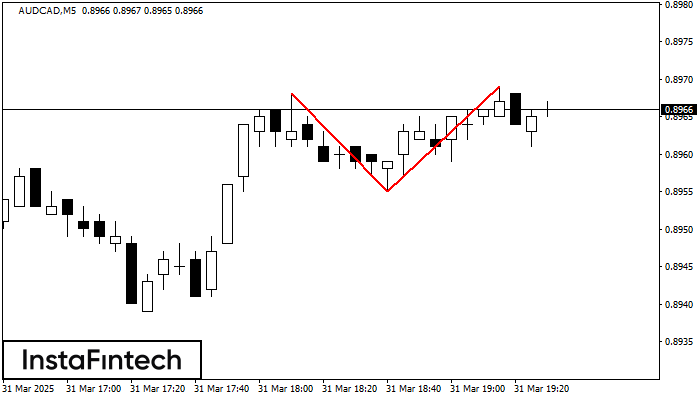
Corak pembalikan Double Top telah dibentuk pada AUDCAD M5. Ciri-ciri: sempadan atas %P0.000000; sempadan bawah 0.8968; sempadan bawah 0.8955; lebar corak adalah 14 mata. Dagangan menjual adalah lebih baik untuk
Carta masa M5 dan M15 mungkin mempunyai lebih banyak titik kemasukan palsu.
Open chart in a new window
Pennant Aliran Menurun
was formed on 31.03 at 18:00:53 (UTC+0)
signal strength 3 of 5

Corak Pennant Aliran Menurun telah dibentuk pada carta #NTDOY M30. Jenis corak ini dicirikan oleh sedikit penurunan di mana selepas itu harga akan bergerak ke arah aliran asal. Sekiranya harga
Open chart in a new window
Pennant Aliran Menurun
was formed on 31.03 at 18:00:41 (UTC+0)
signal strength 3 of 5

Corak Pennant Aliran Menurun telah dibentuk pada carta #NTDOY M30. Ia menandakan potensi kesinambungan aliran yang sedia ada. Spesifikasi: bahagian corak mempunyai koordinat 16.77; unjuran ketinggian flagpole adalah sama dengan
Open chart in a new window