Corak sebenar

Double Top
was formed on 25.03 at 16:00:35 (UTC+0)
signal strength 4 of 5
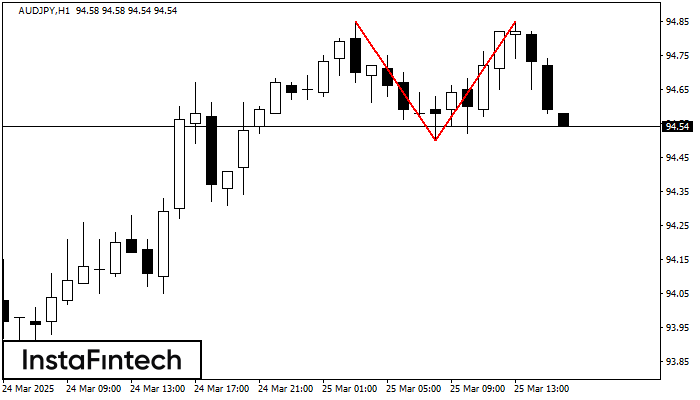
The Double Top pattern has been formed on AUDJPY H1. It signals that the trend has been changed from upwards to downwards. Probably, if the base of the pattern 94.50 is broken, the downward movement will continue.
- All
- All
- Bearish Rectangle
- Bearish Symmetrical Triangle
- Bearish Symmetrical Triangle
- Bullish Rectangle
- Double Top
- Double Top
- Triple Bottom
- Triple Bottom
- Triple Top
- Triple Top
- All
- All
- Buy
- Sale
- All
- 1
- 2
- 3
- 4
- 5
Double Top
was formed on 31.03 at 18:31:19 (UTC+0)
signal strength 1 of 5
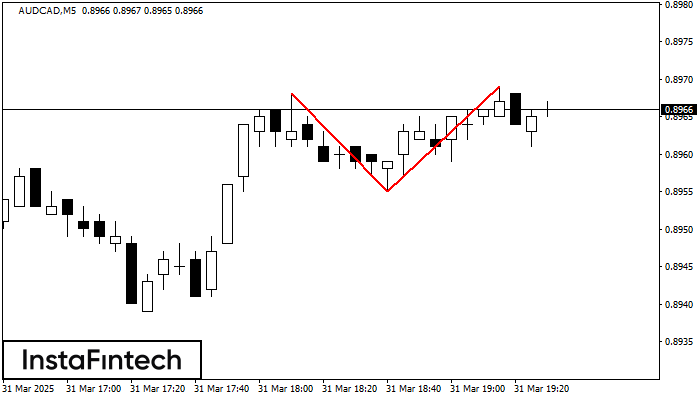
The Double Top reversal pattern has been formed on AUDCAD M5. Characteristics: the upper boundary 0.8968; the lower boundary 0.8955; the width of the pattern is 14 points. Sell trades
The M5 and M15 time frames may have more false entry points.
Open chart in a new window
Bearish pennant
was formed on 31.03 at 18:00:53 (UTC+0)
signal strength 3 of 5

The Bearish pennant pattern has formed on the #NTDOY M30 chart. This pattern type is characterized by a slight slowdown after which the price will move in the direction
Open chart in a new window
Bearish pennant
was formed on 31.03 at 18:00:41 (UTC+0)
signal strength 3 of 5

The Bearish pennant pattern has formed on the #NTDOY M30 chart. It signals potential continuation of the existing trend. Specifications: the pattern’s bottom has the coordinate of 16.77; the projection
Open chart in a new window