Corak sebenar

Double Top
was formed on 27.03 at 02:00:33 (UTC+0)
signal strength 2 of 5
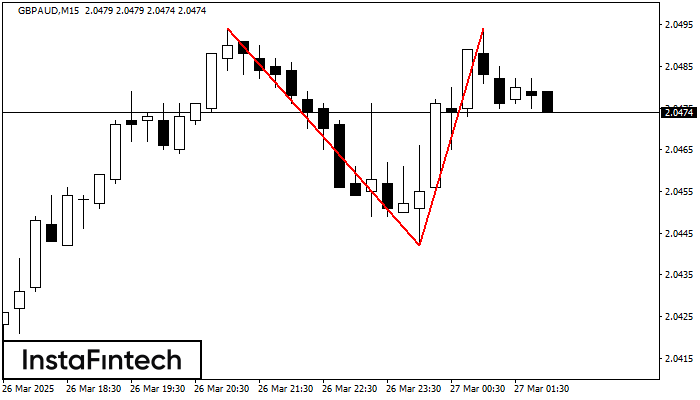
The Double Top pattern has been formed on GBPAUD M15. It signals that the trend has been changed from upwards to downwards. Probably, if the base of the pattern 2.0442 is broken, the downward movement will continue.
The M5 and M15 time frames may have more false entry points.
Juga lihat
- All
- All
- Bearish Rectangle
- Bearish Symmetrical Triangle
- Bearish Symmetrical Triangle
- Bullish Rectangle
- Double Top
- Double Top
- Triple Bottom
- Triple Bottom
- Triple Top
- Triple Top
- All
- All
- Buy
- Sale
- All
- 1
- 2
- 3
- 4
- 5
Double Top
was formed on 14.04 at 00:45:17 (UTC+0)
signal strength 2 of 5

The Double Top pattern has been formed on AUDCAD M15. It signals that the trend has been changed from upwards to downwards. Probably, if the base of the pattern 0.8713
The M5 and M15 time frames may have more false entry points.
Open chart in a new window
Bullish Rectangle
was formed on 14.04 at 00:42:49 (UTC+0)
signal strength 1 of 5
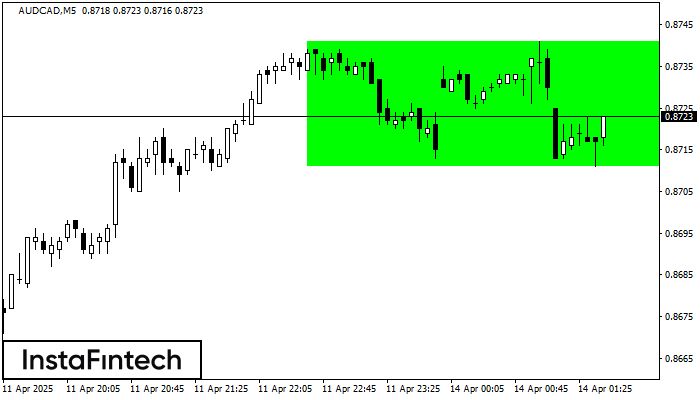
According to the chart of M5, AUDCAD formed the Bullish Rectangle which is a pattern of a trend continuation. The pattern is contained within the following borders: the lower border
The M5 and M15 time frames may have more false entry points.
Open chart in a new window
Triple Top
was formed on 14.04 at 00:30:50 (UTC+0)
signal strength 2 of 5
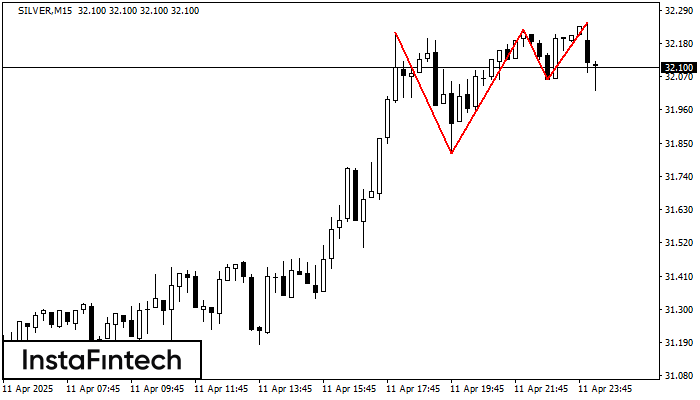
On the chart of the SILVER M15 trading instrument, the Triple Top pattern that signals a trend change has formed. It is possible that after formation of the third peak
The M5 and M15 time frames may have more false entry points.
Open chart in a new window