Corak sebenar

Triple Top
was formed on 30.03 at 11:20:04 (UTC+0)
signal strength 1 of 5

On the chart of the #Bitcoin M5 trading instrument, the Triple Top pattern that signals a trend change has formed. It is possible that after formation of the third peak, the price will try to break through the resistance level 82818.73, where we advise to open a trading position for sale. Take profit is the projection of the pattern’s width, which is 46117 points.
The M5 and M15 time frames may have more false entry points.
Juga lihat
- All
- All
- Bearish Rectangle
- Bearish Symmetrical Triangle
- Bearish Symmetrical Triangle
- Bullish Rectangle
- Double Top
- Double Top
- Triple Bottom
- Triple Bottom
- Triple Top
- Triple Top
- All
- All
- Buy
- Sale
- All
- 1
- 2
- 3
- 4
- 5
Double Top
was formed on 02.04 at 04:20:22 (UTC+0)
signal strength 1 of 5
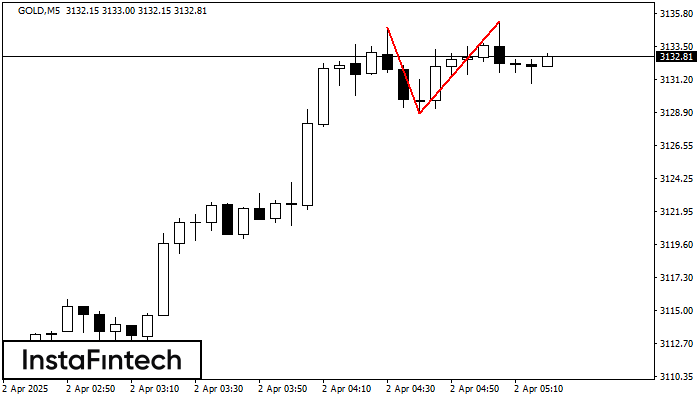
On the chart of GOLD M5 the Double Top reversal pattern has been formed. Characteristics: the upper boundary 3135.25; the lower boundary 3128.79; the width of the pattern 646 points
The M5 and M15 time frames may have more false entry points.
Open chart in a new window
Bullish Flag
was formed on 02.04 at 04:20:19 (UTC+0)
signal strength 1 of 5
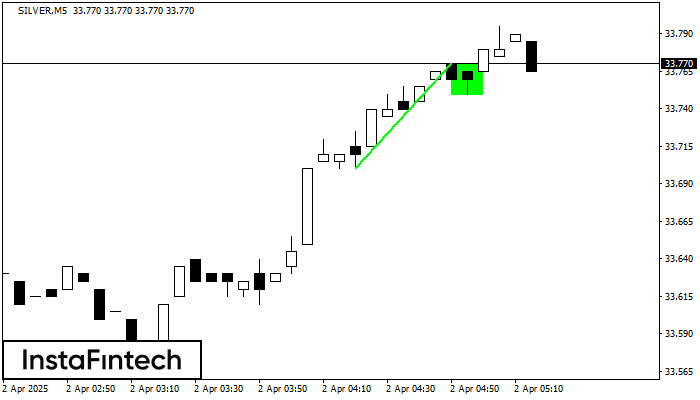
The Bullish Flag pattern has been formed on the chart SILVER M5 which signals that the upward trend will continue. Signals: а break of the peak at 33.77 may push
The M5 and M15 time frames may have more false entry points.
Open chart in a new window
Triple Bottom
was formed on 02.04 at 04:15:26 (UTC+0)
signal strength 2 of 5
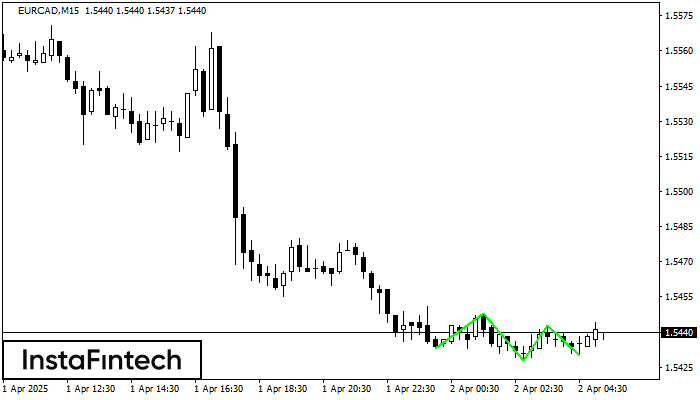
The Triple Bottom pattern has formed on the chart of the EURCAD M15 trading instrument. The pattern signals a change in the trend from downwards to upwards in the case
The M5 and M15 time frames may have more false entry points.
Open chart in a new window