Долзарб паттернлар

Актуальные паттерны
- Все
- Все
- Bearish Rectangle
- Bearish Symmetrical Triangle
- Bearish Symmetrical Triangle
- Bullish Rectangle
- Double Top
- Double Top
- Triple Bottom
- Triple Bottom
- Triple Top
- Triple Top
- Все
- Все
- Покупка
- Продажа
- Все
- 1
- 2
- 3
- 4
- 5
Медвежий вымпел
сформирован 16.04 в 18:15:34 (UTC+0)
сила сигнала 2 из 5
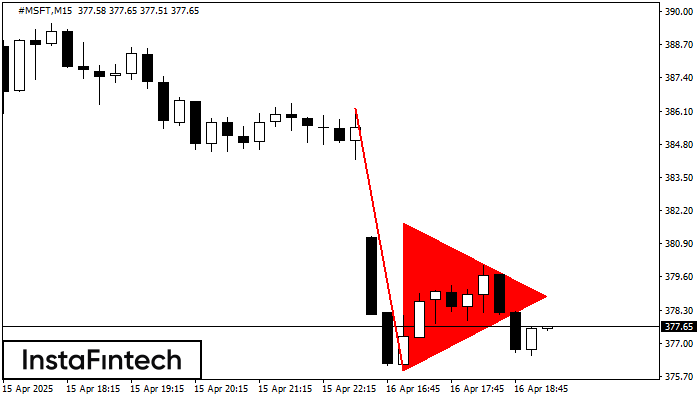
По торговому инструменту #MSFT на M15 сформировалась графическая фигура «Медвежий вымпел». Фигура данного типа характеризует небольшое замедление, после которого движение продолжится в исходном тренде. В случае если котировке удастся зафиксироваться
Таймфреймы М5 и М15 могут иметь больше ложных точек входа.
Открыть график инструмента в новом окне
Медвежий вымпел
сформирован 16.04 в 18:00:05 (UTC+0)
сила сигнала 2 из 5
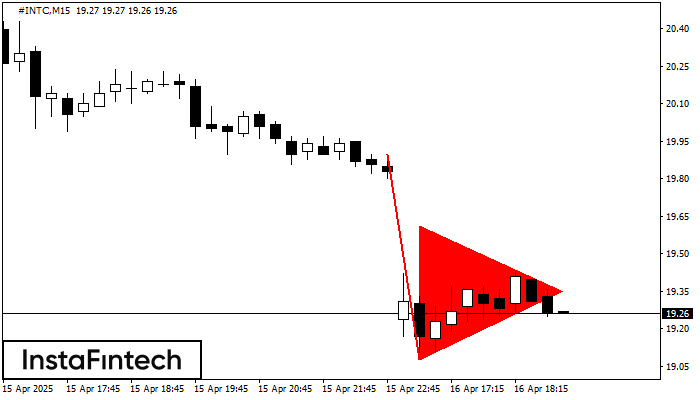
На графике #INTC M15 сформировалась фигура «Медвежий вымпел», которая сигнализирует о возможном продолжении тренда. Характеристика: основание фигуры имеет координаты 19.08; проекция высоты флагштока равна 82 пунктов. В случае если цена
Таймфреймы М5 и М15 могут иметь больше ложных точек входа.
Открыть график инструмента в новом окне
Тройная вершина
сформирован 16.04 в 17:50:25 (UTC+0)
сила сигнала 1 из 5
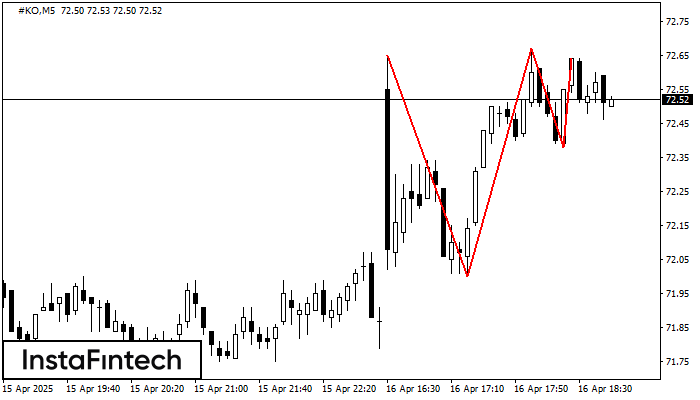
По #KO на M5 сформировалась фигура «Тройная вершина». Характеристика: Границы имеют восходящий угол. Нижняя граница фигуры имеет координаты 72.00/72.38, при этом верхняя граница 72.65/72.64. Проекция ширины 65 пунктов. Формирование фигуры
Таймфреймы М5 и М15 могут иметь больше ложных точек входа.
Открыть график инструмента в новом окне
Двойная вершина
сформирован 16.04 в 17:20:23 (UTC+0)
сила сигнала 1 из 5
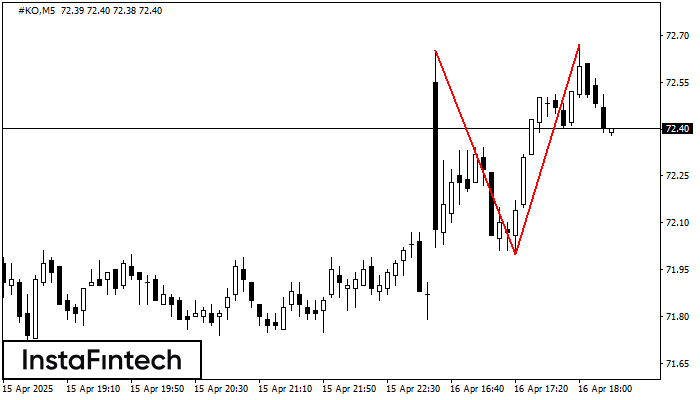
По торговому инструменту #KO на M5 сформировалась фигура «Двойная вершина», которая сигнализирует нам об изменении тенденции с восходящей на нисходящую. Вероятно, что, в случае пробоя основания фигуры 72.00, возможно дальнейшее
Таймфреймы М5 и М15 могут иметь больше ложных точек входа.
Открыть график инструмента в новом окне
Медвежий флаг
сформирован 16.04 в 17:05:48 (UTC+0)
сила сигнала 2 из 5
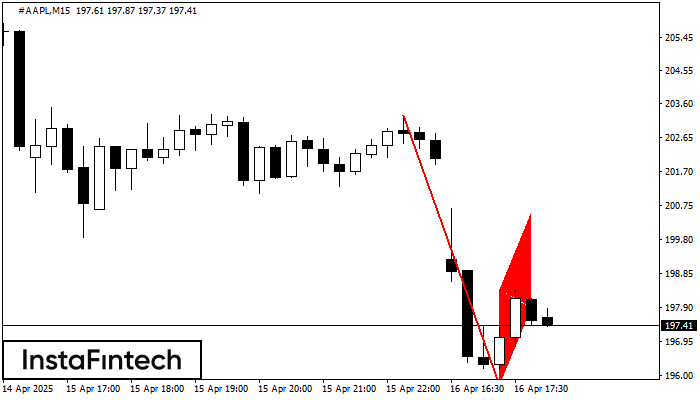
На графике #AAPL M15 сформировалась графическая фигура «Медвежий флаг». Ссылаясь на теорию графического анализа, можно сказать, что в ближайшее время тренд продолжит нисходящее движение, как только цена зафиксируется ниже минимума
Таймфреймы М5 и М15 могут иметь больше ложных точек входа.
Открыть график инструмента в новом окне
Медвежий вымпел
сформирован 16.04 в 17:05:44 (UTC+0)
сила сигнала 2 из 5
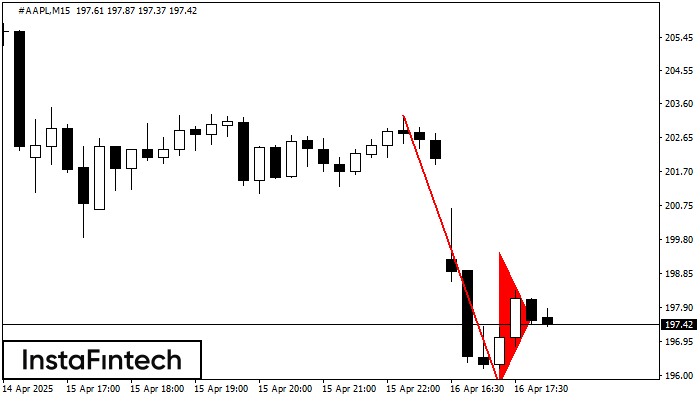
По торговому инструменту #AAPL на M15 сформировалась графическая фигура «Медвежий вымпел». Фигура данного типа характеризует небольшое замедление, после которого движение продолжится в исходном тренде. В случае если котировке удастся зафиксироваться
Таймфреймы М5 и М15 могут иметь больше ложных точек входа.
Открыть график инструмента в новом окне
Двойная вершина
сформирован 16.04 в 17:05:31 (UTC+0)
сила сигнала 1 из 5
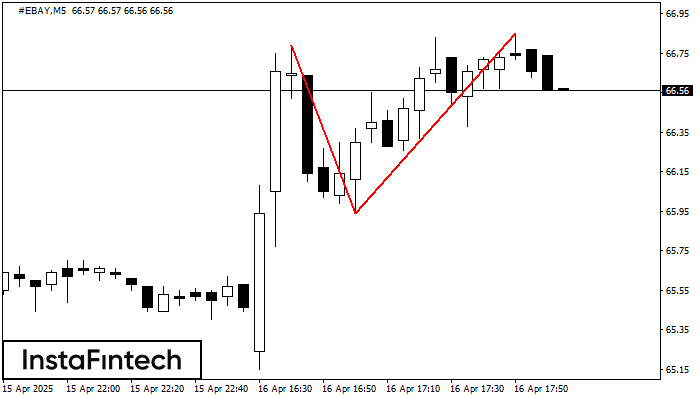
По #EBAY на M5 сформировалась разворотная фигура «Двойная вершина». Характеристика: Верхняя граница 66.79; Нижняя граница 65.94; Ширина фигуры 91 пунктов. Позицию на продажу возможно открыть ниже нижней границы 65.94
Таймфреймы М5 и М15 могут иметь больше ложных точек входа.
Открыть график инструмента в новом окне
Бычий симметричный треугольник
сформирован 16.04 в 17:03:02 (UTC+0)
сила сигнала 3 из 5
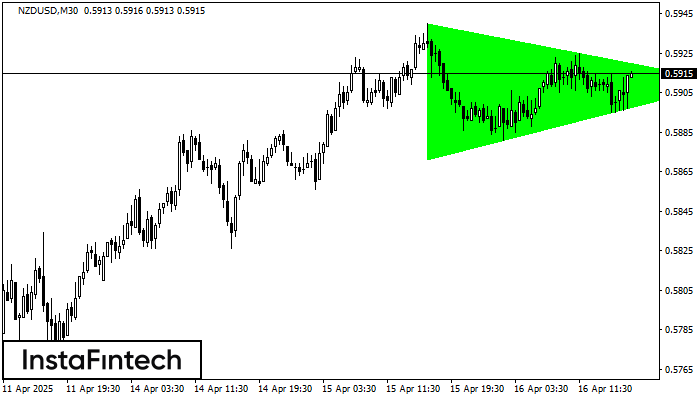
По NZDUSD на M30 сформировалась фигура «Бычий симметричный треугольник». Нижняя граница фигуры имеет координаты 0.5871/0.5910, при этом верхняя граница 0.5940/0.5910. Формирование фигуры «Бычий симметричный треугольник» наиболее вероятным образом свидетельствует
Открыть график инструмента в новом окне
Бычий симметричный треугольник
сформирован 16.04 в 17:01:05 (UTC+0)
сила сигнала 4 из 5
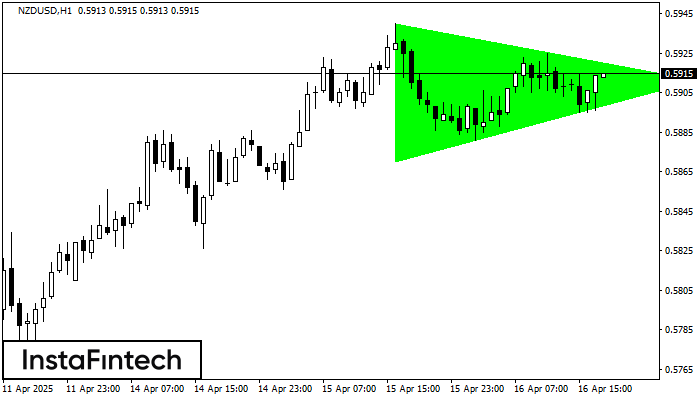
По NZDUSD на H1 сформировалась фигура «Бычий симметричный треугольник», которая сигнализирует нам о продолжении тенденции. Характеристика: Верхняя граница фигуры имеет координаты 0.5940/0.5911; Нижняя граница 0.5870/0.5911; Проекция ширины фигуры 70 пунктов
Открыть график инструмента в новом окне