Долзарб паттернлар

Двойная вершина
сформирован 14.03 в 19:45:19 (UTC+0)
сила сигнала 2 из 5
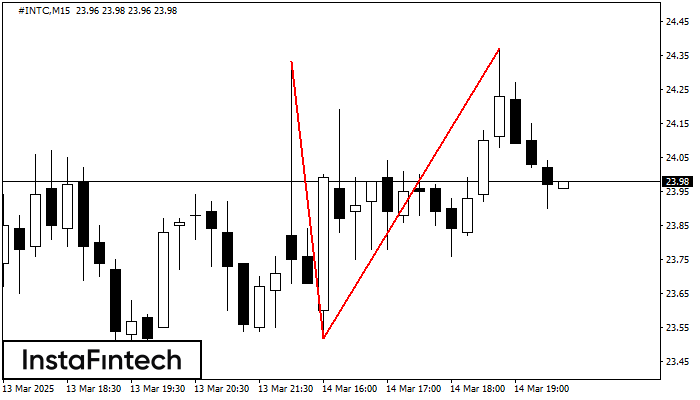
На торговом графике #INTC M15 сформировалась разворотная фигура «Двойная вершина». Характеристика: Верхняя граница 24.37; Нижняя граница 23.52; Ширина фигуры 85 пунктов. Сигнал: Пробой нижней границы 23.52 приведет к дальнейшему нисходящему движению с перспективой хода к уровню 23.30.
Таймфреймы М5 и М15 могут иметь больше ложных точек входа.
- Все
- Все
- Bearish Rectangle
- Bearish Symmetrical Triangle
- Bearish Symmetrical Triangle
- Bullish Rectangle
- Double Top
- Double Top
- Triple Bottom
- Triple Bottom
- Triple Top
- Triple Top
- Все
- Все
- Покупка
- Продажа
- Все
- 1
- 2
- 3
- 4
- 5
Bearish Rectangle
was formed on 18.03 at 15:36:48 (UTC+0)
signal strength 1 of 5
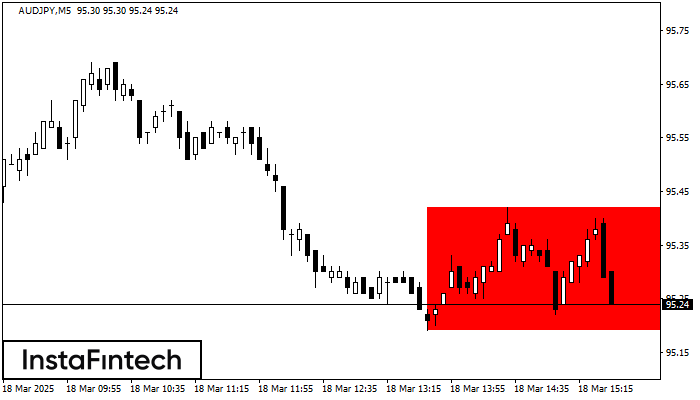
According to the chart of M5, AUDJPY formed the Bearish Rectangle. This type of a pattern indicates a trend continuation. It consists of two levels: resistance 95.42 - 0.00
The M5 and M15 time frames may have more false entry points.
Open chart in a new window
Bearish Symmetrical Triangle
was formed on 18.03 at 15:34:48 (UTC+0)
signal strength 1 of 5
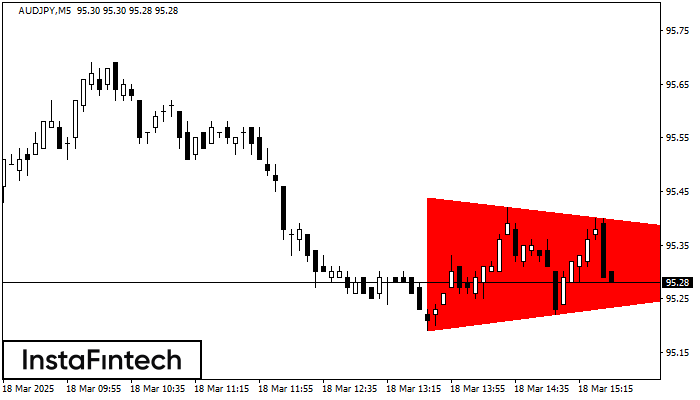
According to the chart of M5, AUDJPY formed the Bearish Symmetrical Triangle pattern. Description: The lower border is 95.19/95.32 and upper border is 95.44/95.32. The pattern width is measured
The M5 and M15 time frames may have more false entry points.
Open chart in a new window
Triple Top
was formed on 18.03 at 15:34:35 (UTC+0)
signal strength 1 of 5
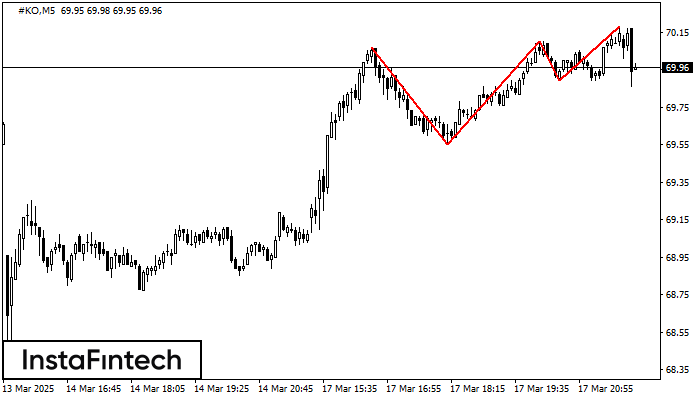
The Triple Top pattern has formed on the chart of the #KO M5 trading instrument. It is a reversal pattern featuring the following characteristics: resistance level -11, support level -34
The M5 and M15 time frames may have more false entry points.
Open chart in a new window