Veja também
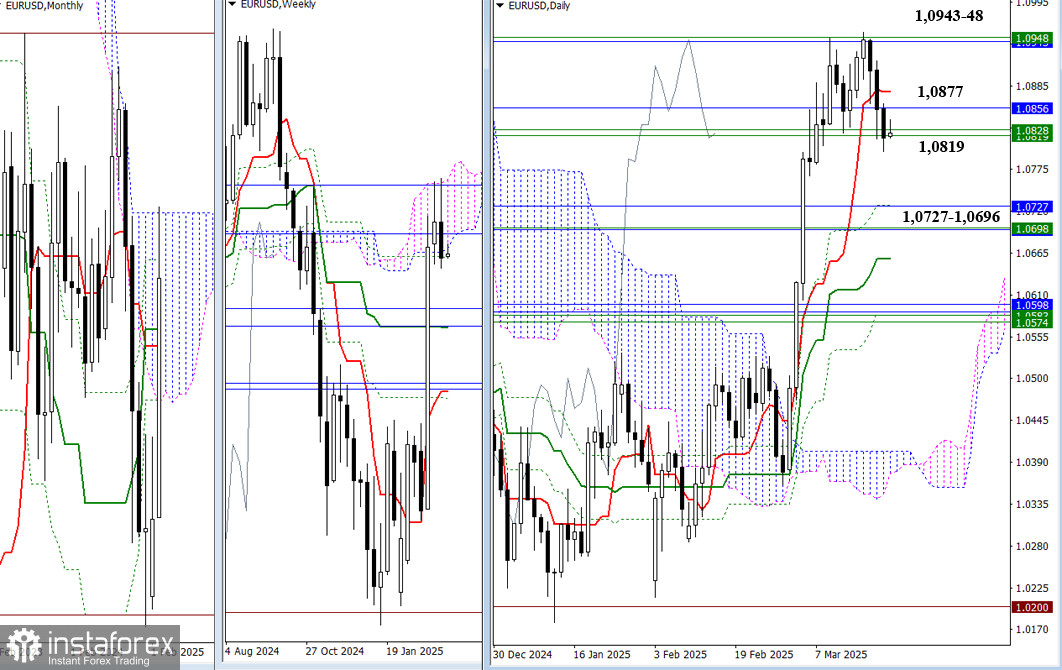
Recently, the pair has been testing resistance levels from the weekly Ichimoku cloud (1.0946–1.0825) and monthly levels (1.0943–1.0856). Last week, sellers initiated a rejection and closed below these resistance zones. As a result, the main task for the bears now is to confirm and extend this rejection. If successful, their focus will shift to the cluster of supports around 1.0727–1.0696 (monthly Tenkan + Kijun, weekly Kijun, and daily levels). If sellers fail to maintain control, consolidation may develop around the current support area (1.0877–1.0819). In this case, buyers could regain the initiative at any moment, aiming once again for the upper boundaries of the monthly (1.0943) and weekly (1.0948) Ichimoku clouds.
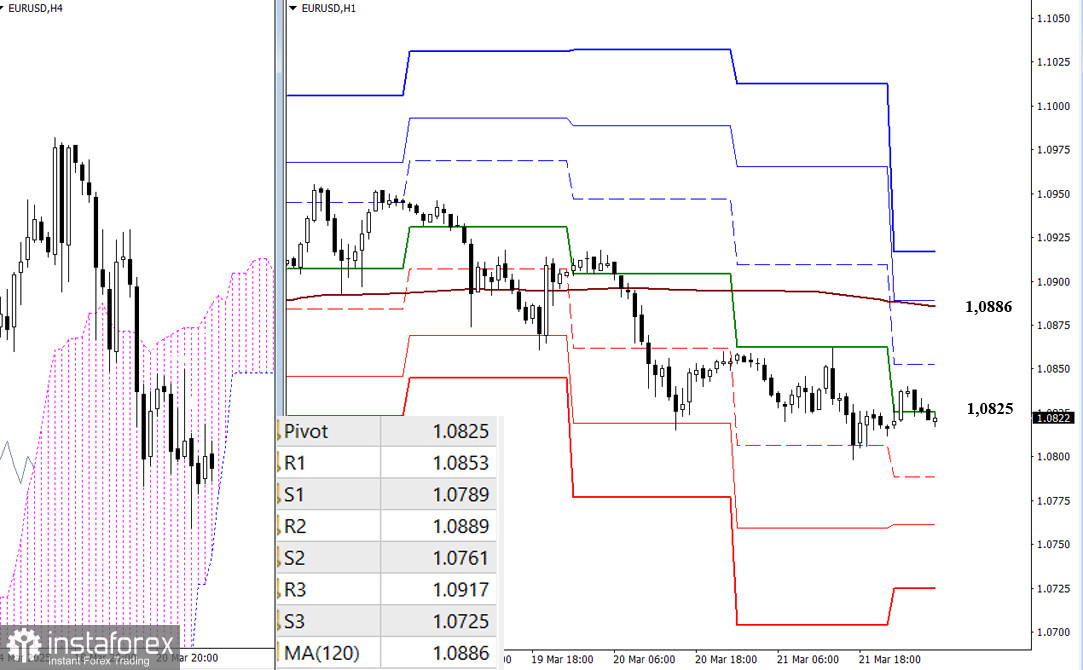
On the lower timeframes, sellers currently maintain the upper hand. A continuation of the decline today is possible through a break below the classic Pivot support levels (1.0789 – 1.0761 – 1.0725). If buyers extend the ongoing correction, the key focus will be testing and breaking the weekly long-term trend level (1.0886). A trend reversal at that level would shift the balance of power, giving intraday buyers access to the following targets at the classic Pivot resistance levels (1.0889 – 1.0917).
***
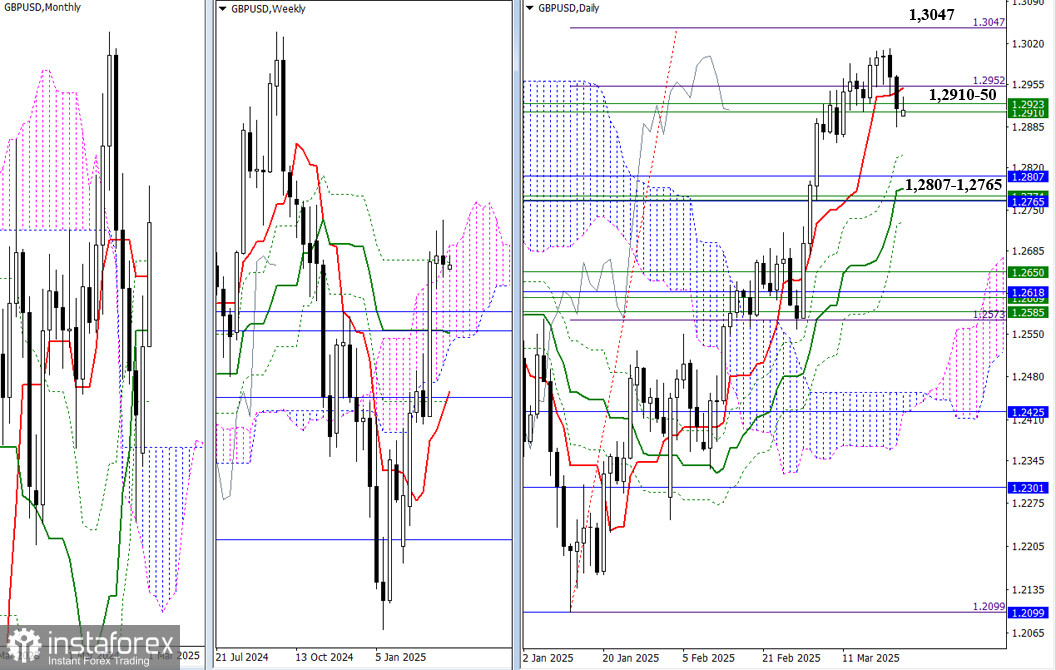
For the past two weeks, the market has remained indecisive, hovering around the area of the daily short-term trend (1.2950) and weekly levels (1.2910–1.2923). For the bulls, the target of breaking through the daily Ichimoku cloud (1.3047) remains unfulfilled. If bears are the first to exit this zone of uncertainty, the next downside target will be the cluster of supports near the monthly levels (1.2807–1.2765).
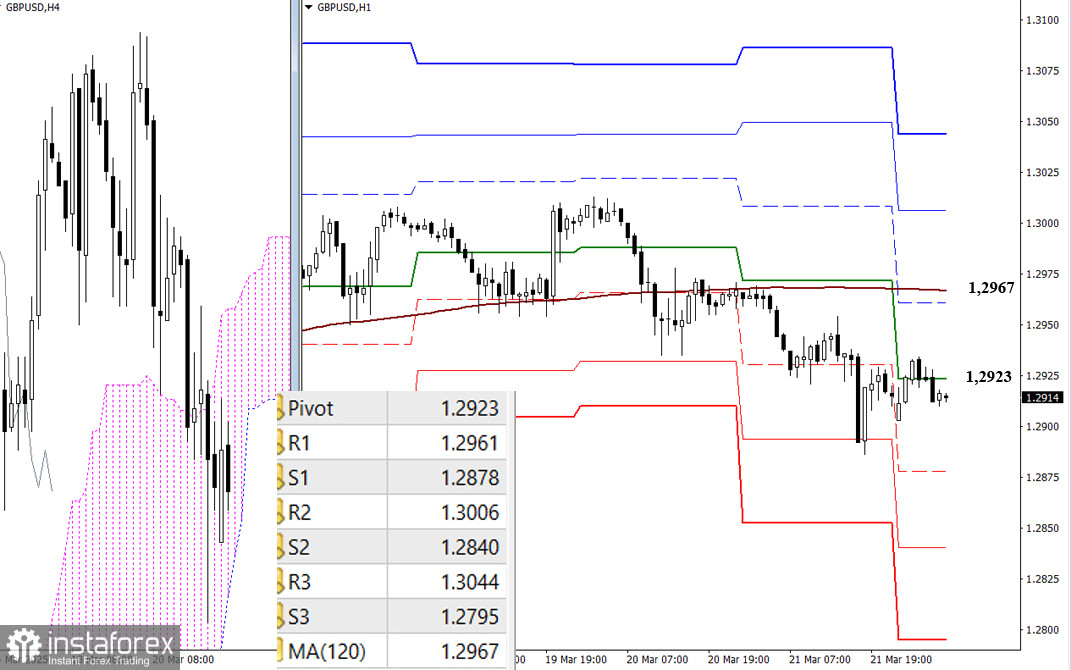
At the moment, sellers have the main advantage on the lower timeframes. Intraday support targets for further downside can be noted at 1.2878 – 1.2840 – 1.2795. The current balance of power can only be altered by a break and reversal of the weekly long-term trend level (1.2967). If buyers consolidate above this level and gain the upper hand, today's targets will be the classic Pivot resistance levels (1.3006 – 1.3044).
***
You have already liked this post today
*A análise de mercado aqui postada destina-se a aumentar o seu conhecimento, mas não dar instruções para fazer uma negociação.
Nosso plano de negociação para as próximas horas é aguardar que o euro se recupere até os níveis de resistência próximos de 1,1429 ou 1,1435 para vender, com alvos
No gráfico de 4 horas, o instrumento da commodity prata apresenta sinais de fortalecimento. Esse cenário é confirmado pelo movimento do preço, que está acima da WMA (30, deslocamento 2)
Embora o índice Nasdaq 100 esteja se movimentando lateralmente no gráfico de 4 horas, a faixa de oscilação é relativamente ampla, o que ainda representa uma oportunidade promissora. Atualmente
Os preços do ouro passaram recentemente por uma correção significativa, refletindo as expectativas de que Estados Unidos e China iniciem negociações concretas sobre tarifas e comércio em geral. A declaração
Com a presença de uma divergência entre o movimento de preços do par AUD/JPY e o indicador Stochastic Oscillator, além do preço estar acima da média móvel ponderada (WMA)
Ao observar o gráfico de 4 horas, o ouro ainda apresenta viés de alta. No entanto, a divergência entre o movimento de preços do ouro e o indicador Stochastic Oscillator
Ao analisarmos o gráfico de 4 horas do par cruzado GBP/CHF, observamos diversos elementos interessantes. Primeiramente, o surgimento de um padrão de triângulo, aliado ao movimento
Com o par AUD/CAD se movendo acima da média móvel ponderada de 21 períodos (WMA 21), que apresenta inclinação positiva, e com a ocorrência de convergência entre o movimento
Com o surgimento da convergência entre o movimento de preço do principal par de moedas USD/JPY, o indicador Oscilador Estocástico e a posição da EMA (100), que está acima
Your IP address shows that you are currently located in the USA. If you are a resident of the United States, you are prohibited from using the services of InstaFintech Group including online trading, online transfers, deposit/withdrawal of funds, etc.
If you think you are seeing this message by mistake and your location is not the US, kindly proceed to the website. Otherwise, you must leave the website in order to comply with government restrictions.
Why does your IP address show your location as the USA?
Please confirm whether you are a US resident or not by clicking the relevant button below. If you choose the wrong option, being a US resident, you will not be able to open an account with InstaTrade anyway.
We are sorry for any inconvenience caused by this message.