Padrões atuais

Padrões são modelos gráficos que são formados no gráfico pelo preço. Segundo um dos postulados da análise técnica, a história (movimento de preços) se repete. Isso significa que os movimentos de preços geralmente são semelhantes nas mesmas situações, o que possibilita prever o desenvolvimento futuro da situação com alta probabilidade.
Os padrões relevantes da InstaTrade são um serviço fácil de usar, que permite que você esteja ciente das últimas mudanças no mercado e reaja a indícios do mercado a tempo. Em nosso serviço, você sempre encontrará os padrões mais recentes e relevantes em qualquer par e em qualquer período gráfico.
Head and Shoulders
was formed on 21.03 at 05:06:39 (UTC+0)
signal strength 1 of 5
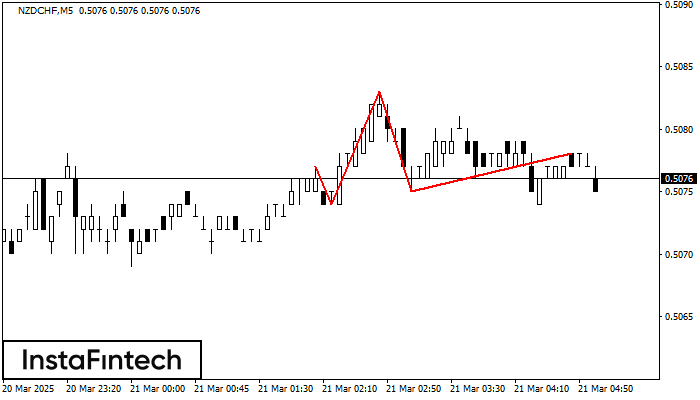
The NZDCHF M5 formed the Head and Shoulders pattern with the following features: The Head’s top is at 0.5083, the Neckline and the upward angle are at 0.5074/0.5075. The formation of this pattern can bring about changes in the current trend from bullish to bearish. In case the pattern triggers the expected changes, the price of NZDCHF will go towards 0.5060.
The M5 and M15 time frames may have more false entry points.
Veja também
- All
- All
- Bearish Rectangle
- Bearish Symmetrical Triangle
- Bearish Symmetrical Triangle
- Bullish Rectangle
- Double Top
- Double Top
- Triple Bottom
- Triple Bottom
- Triple Top
- Triple Top
- All
- All
- Buy
- Sale
- All
- 1
- 2
- 3
- 4
- 5
Fundo duplo
was formed on 28.03 at 05:30:51 (UTC+0)
signal strength 1 of 5
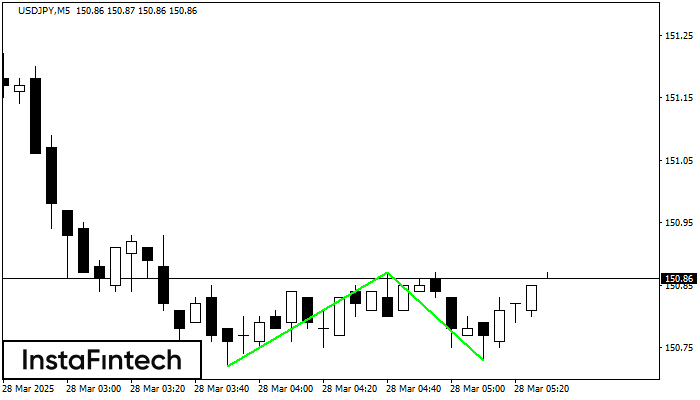
O padrão Fundo duplo foi formado em USDJPY M5. Características: o nível de suporte 150.72; o nível de resistência 150.87; a largura do padrão 15 pontos. Se o nível
Os intervalos M5 e M15 podem ter mais pontos de entrada falsos.
Open chart in a new window
Triângulo Simétrico de Baixa
was formed on 28.03 at 04:36:48 (UTC+0)
signal strength 1 of 5
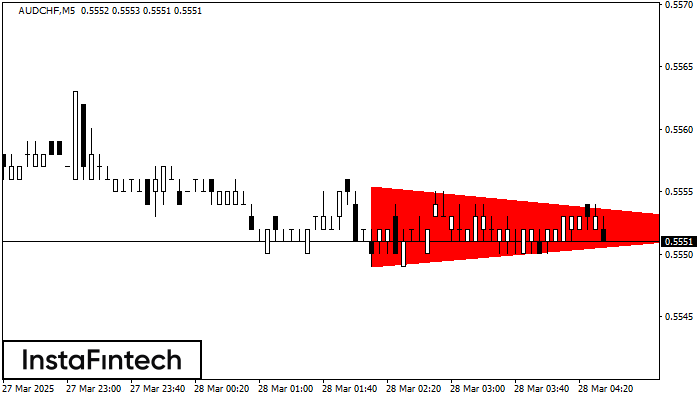
De acordo com o gráfico de M5, AUDCHF formou o padrão de Triângulo Simétrico de Baixa. Recomendações de negociação: Uma quebra do limite inferior de 0.5549 pode encorajar a continuação
Os intervalos M5 e M15 podem ter mais pontos de entrada falsos.
Open chart in a new window
Bandeira de Baixa
was formed on 28.03 at 03:22:22 (UTC+0)
signal strength 1 of 5
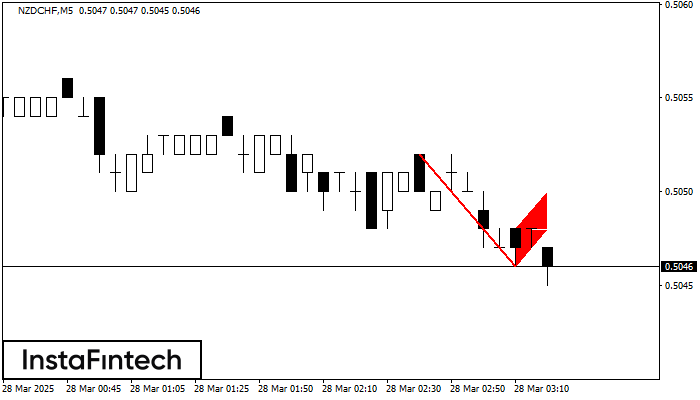
O padrão Bandeira de Baixa foi formado no gráfico NZDCHF M5. Portanto, é provável que a tendência de queda continue a curto prazo. Assim que o preço cair abaixo
Os intervalos M5 e M15 podem ter mais pontos de entrada falsos.
Open chart in a new window