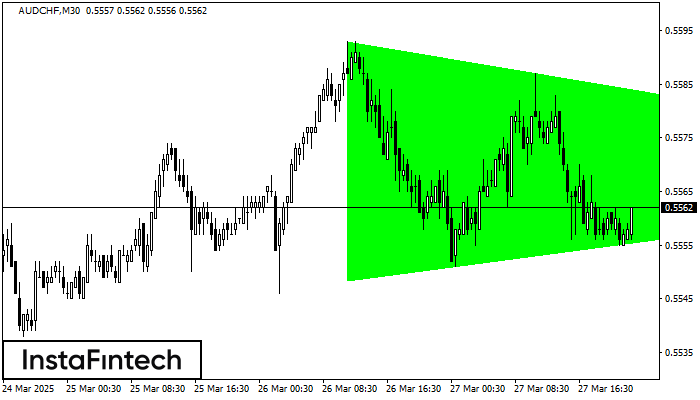
Bullish Symmetrical Triangle
was formed on 27.03 at 23:09:03 (UTC+0)
signal strength 3 of 5

According to the chart of M30, AUDCHF formed the Bullish Symmetrical Triangle pattern, which signals the trend will continue. Description. The upper border of the pattern touches the coordinates 0.5593/0.5568 whereas the lower border goes across 0.5548/0.5568. The pattern width is measured on the chart at 45 pips. If the Bullish Symmetrical Triangle pattern is in progress during the upward trend, this indicates the current trend will go on. In case 0.5568 is broken, the price could continue its move toward 0.5598.
Veja também
- All
- All
- Bearish Rectangle
- Bearish Symmetrical Triangle
- Bearish Symmetrical Triangle
- Bullish Rectangle
- Double Top
- Double Top
- Triple Bottom
- Triple Bottom
- Triple Top
- Triple Top
- All
- All
- Buy
- Sale
- All
- 1
- 2
- 3
- 4
- 5
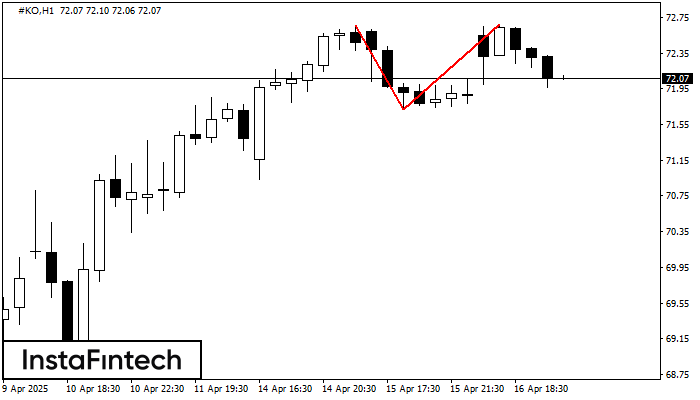
Topo duplo
was formed on 16.04 at 20:30:32 (UTC+0)
signal strength 4 of 5
No gráfico de #KO H1 o padrão de reversão Topo duplo foi formado. Características: o limite superior 72.67; o limite inferior 71.72; a largura do padrão 95 pontos. O sinal
Open chart in a new window
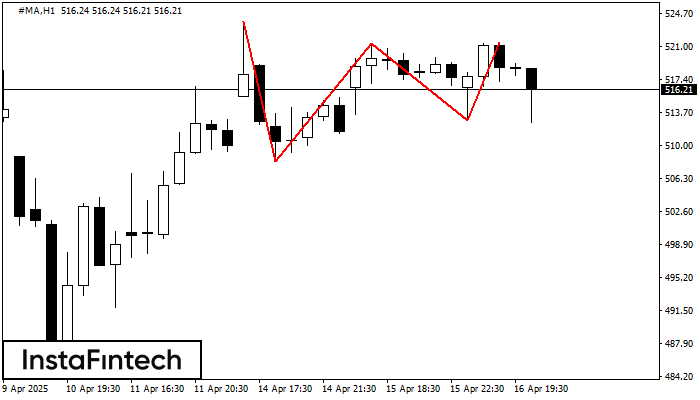
Topo triplo
was formed on 16.04 at 20:30:06 (UTC+0)
signal strength 4 of 5
No gráfico do instrumento de negociação #MA H1, o padrão Topo triplo que sinaliza uma mudança de tendência se formou. É possível que após a formação do terceiro pico
Open chart in a new window
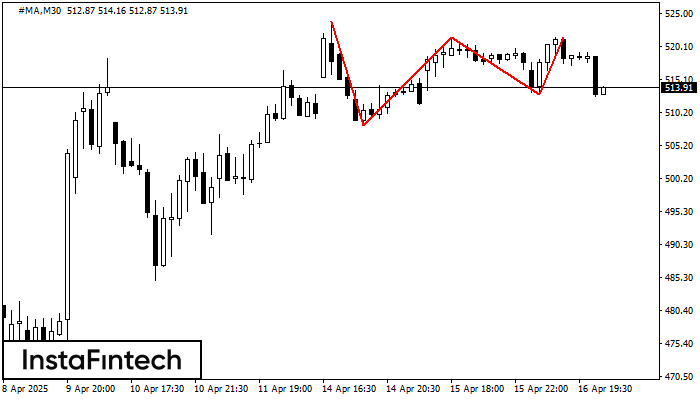
Topo triplo
was formed on 16.04 at 20:00:08 (UTC+0)
signal strength 3 of 5
O padrão Topo triplo se formou no gráfico de #MA M30. Características do padrão: os limites têm um ângulo ascendente; a linha inferior do padrão tem as coordenadas 508.17/512.83
Open chart in a new window


