Padrões atuais

Padrões são modelos gráficos que são formados no gráfico pelo preço. Segundo um dos postulados da análise técnica, a história (movimento de preços) se repete. Isso significa que os movimentos de preços geralmente são semelhantes nas mesmas situações, o que possibilita prever o desenvolvimento futuro da situação com alta probabilidade.
Os padrões relevantes da InstaTrade são um serviço fácil de usar, que permite que você esteja ciente das últimas mudanças no mercado e reaja a indícios do mercado a tempo. Em nosso serviço, você sempre encontrará os padrões mais recentes e relevantes em qualquer par e em qualquer período gráfico.
Bearish Symmetrical Triangle
was formed on 01.04 at 09:18:41 (UTC+0)
signal strength 4 of 5

According to the chart of H1, NZDJPY formed the Bearish Symmetrical Triangle pattern. Description: The lower border is 84.61/84.93 and upper border is 85.30/84.93. The pattern width is measured on the chart at -69 pips. The formation of the Bearish Symmetrical Triangle pattern evidently signals a continuation of the downward trend. In other words, if the scenario comes true and NZDJPY breaches the lower border, the price could continue its move toward 84.53.
Veja também
- All
- All
- Bearish Rectangle
- Bearish Symmetrical Triangle
- Bearish Symmetrical Triangle
- Bullish Rectangle
- Double Top
- Double Top
- Triple Bottom
- Triple Bottom
- Triple Top
- Triple Top
- All
- All
- Buy
- Sale
- All
- 1
- 2
- 3
- 4
- 5
Topo duplo
was formed on 10.04 at 10:00:26 (UTC+0)
signal strength 4 of 5
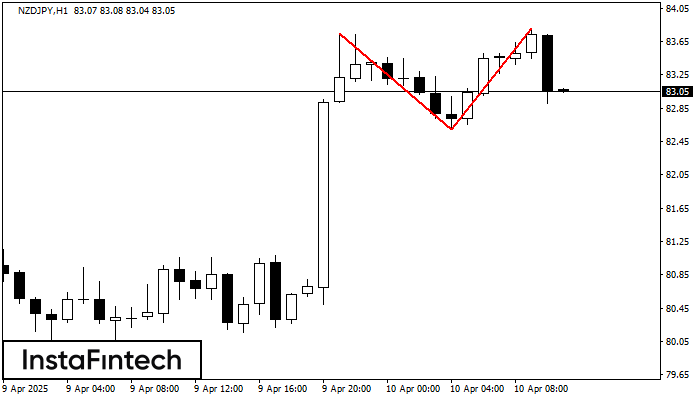
No gráfico de NZDJPY H1 o padrão de reversão Topo duplo foi formado. Características: o limite superior 83.80; o limite inferior 82.60; a largura do padrão 120 pontos. O sinal
Open chart in a new window
Cabeça & Ombros
was formed on 10.04 at 10:00:06 (UTC+0)
signal strength 1 of 5
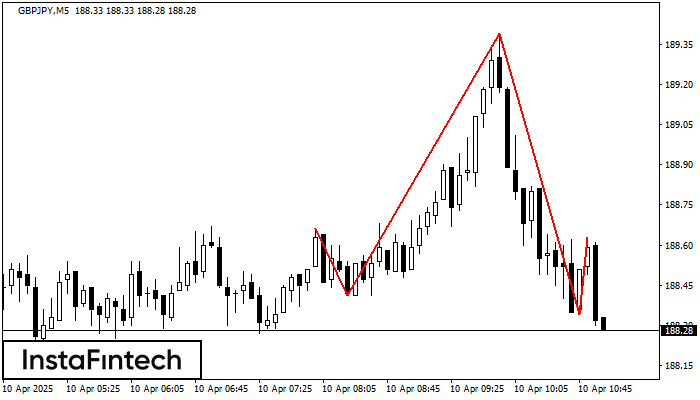
Os GBPJPY M5 formaram o padrão Cabeça & Ombros com as seguintes características: O topo da cabeça está em 189.39, a linha do pescoço e o ângulo para cima estão
Os intervalos M5 e M15 podem ter mais pontos de entrada falsos.
Open chart in a new window
Topo duplo
was formed on 10.04 at 09:30:26 (UTC+0)
signal strength 3 of 5
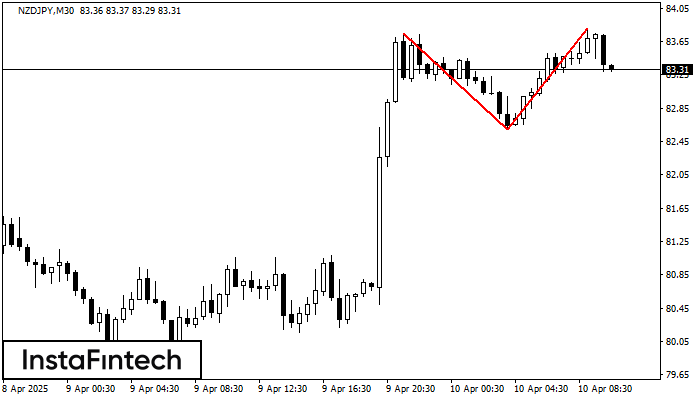
O padrão de reversão Topo duplo foi formado em NZDJPY M30. Características: o limite superior 83.75; o limite inferior 82.60; a largura do padrão é de 120 pontos. As operações
Open chart in a new window