Padrões atuais

Padrões são modelos gráficos que são formados no gráfico pelo preço. Segundo um dos postulados da análise técnica, a história (movimento de preços) se repete. Isso significa que os movimentos de preços geralmente são semelhantes nas mesmas situações, o que possibilita prever o desenvolvimento futuro da situação com alta probabilidade.
Os padrões relevantes da InstaTrade são um serviço fácil de usar, que permite que você esteja ciente das últimas mudanças no mercado e reaja a indícios do mercado a tempo. Em nosso serviço, você sempre encontrará os padrões mais recentes e relevantes em qualquer par e em qualquer período gráfico.
Triple Top
was formed on 03.04 at 07:15:39 (UTC+0)
signal strength 2 of 5
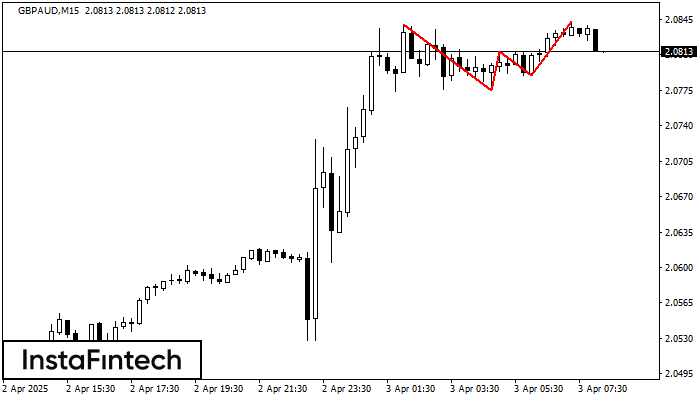
On the chart of the GBPAUD M15 trading instrument, the Triple Top pattern that signals a trend change has formed. It is possible that after formation of the third peak, the price will try to break through the resistance level 2.0775, where we advise to open a trading position for sale. Take profit is the projection of the pattern’s width, which is 65 points.
The M5 and M15 time frames may have more false entry points.
Veja também
- All
- All
- Bearish Rectangle
- Bearish Symmetrical Triangle
- Bearish Symmetrical Triangle
- Bullish Rectangle
- Double Top
- Double Top
- Triple Bottom
- Triple Bottom
- Triple Top
- Triple Top
- All
- All
- Buy
- Sale
- All
- 1
- 2
- 3
- 4
- 5
Retângulo de alta
was formed on 14.04 at 03:32:18 (UTC+0)
signal strength 1 of 5
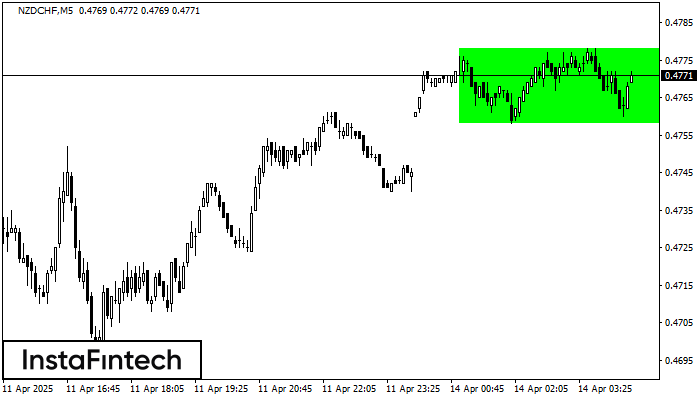
De acordo com o gráfico de M5, NZDCHF formou Retângulo de alta. O padrão indica uma continuação da tendência. O limite superior é 0.4778, o limite inferior é 0.4758
Os intervalos M5 e M15 podem ter mais pontos de entrada falsos.
Open chart in a new window
Fundo triplo
was formed on 14.04 at 03:00:24 (UTC+0)
signal strength 2 of 5

O padrão Fundo triplo foi formado em EURNZD M15. Possui as seguintes características: nível de resistência 1.9498/1.9463; nível de suporte 1.9409/1.9402; a largura é de 89 pontos. Se houver
Os intervalos M5 e M15 podem ter mais pontos de entrada falsos.
Open chart in a new window
Triângulo Simétrico de Alta
was formed on 14.04 at 02:51:59 (UTC+0)
signal strength 1 of 5

De acordo com o gráfico de M5, GBPAUD formou o padrão de Triângulo Simétrico de Alta. O limite inferior do padrão toca as coordenadas 2.0704/2.0775 enquanto o limite superior cruza
Os intervalos M5 e M15 podem ter mais pontos de entrada falsos.
Open chart in a new window