#SPX (S&P 500 Index). Exchange rate and online charts.
Currency converter
03 Apr 2025 05:36
(-0.01%)
Closing price, the previous day.
Opening price.
The highest price over the last trading day.
The lowest price over the last trading day
Price range high in the last week
Price range low in the last week
Composed by Standard & Poor's, the S&P 500 index was introduced in 1923. It is a market-capitalization-weighted index that is associated with many ticker symbols, including GSPC, INX, and $SPX.
The S&P 500 index includes 500 components which are stocks of large companies traded at the New York Stock Exchange (NYSE) or the NASDAQ. The S&P 500 index reflects the overall capitalization rate of these stocks. The list of companies in the S&P 500 comprises only the biggest U.S. corporations and does not include private firms and companies with insufficient liquidity. In addition, the list of S&P 500 components represents various sectors of the U.S. economy. Due to the fact that the majority of the index components are American companies, many experts consider it an accurate indicator of the U.S. current economic conditions as well as its future changes. The main trait of the index is its role in the world economy: the S&P 500 is well-diversified and perfectly mirrors the U.S. market state.
According to analysts, there are several advantages of trading the S&P 500. One of them is an opportunity to trade on the U.S. stock market via CFDs on the leading stock index. Besides, this index is a great trading tool for traders because it has high liquidity and is traded within convenient hours of the American trading session.
See Also
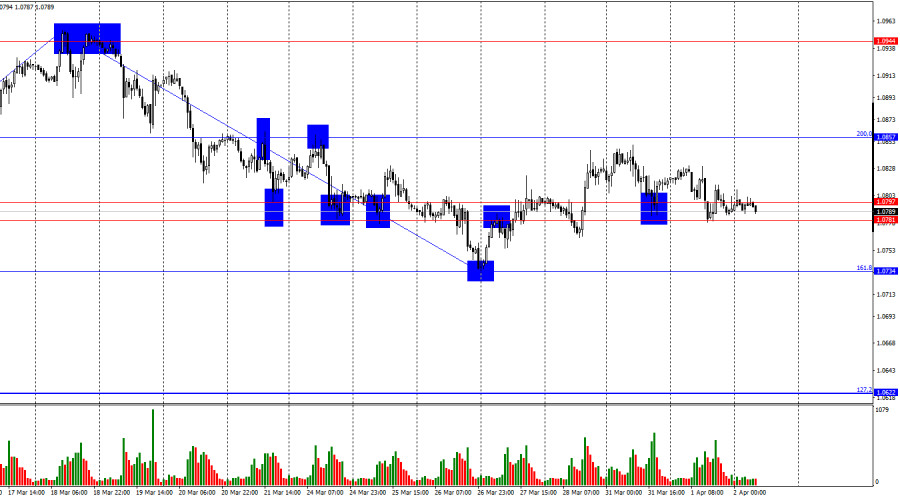
- Forecast for EUR/USD on April 2, 2025
Author: Samir Klishi
11:23 2025-04-02 UTC+2
1033
XAU/USD. Analysis and ForecastAuthor: Irina Yanina
13:22 2025-04-02 UTC+2
958
Technical analysis of EUR/USD, USD/JPY, USDX and Bitcoin.Author: Sebastian Seliga
11:34 2025-04-02 UTC+2
913
- Today, the AUD/USD pair is showing positive momentum, rebounding from nearly a four-week low.
Author: Irina Yanina
12:25 2025-04-02 UTC+2
913
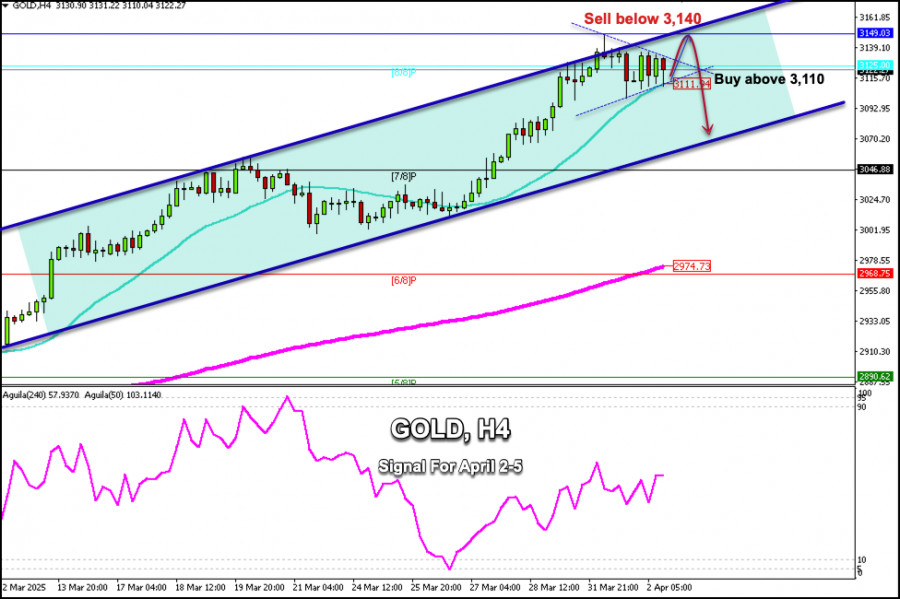
Technical analysisTrading Signals for GOLD (XAU/USD) for April 2-5, 2025: sell below $3,140 or buy above $3,110 (21 SMA - symmetrical triangle)
The symmetrical triangle pattern observed on the H4 chart shows that gold could experience a strong bullish impulse to reach 3,169, where resistance R_1 is located. Below this area, a technical correction could occur.Author: Dimitrios Zappas
15:15 2025-04-02 UTC+2
913
Today the USD/CAD pair is attempting to halt yesterday's decline, trying to hold above the 1.4300 level.Author: Irina Yanina
12:22 2025-04-02 UTC+2
898
- Market overview on April 2
Author: Jozef Kovach
12:15 2025-04-02 UTC+2
793
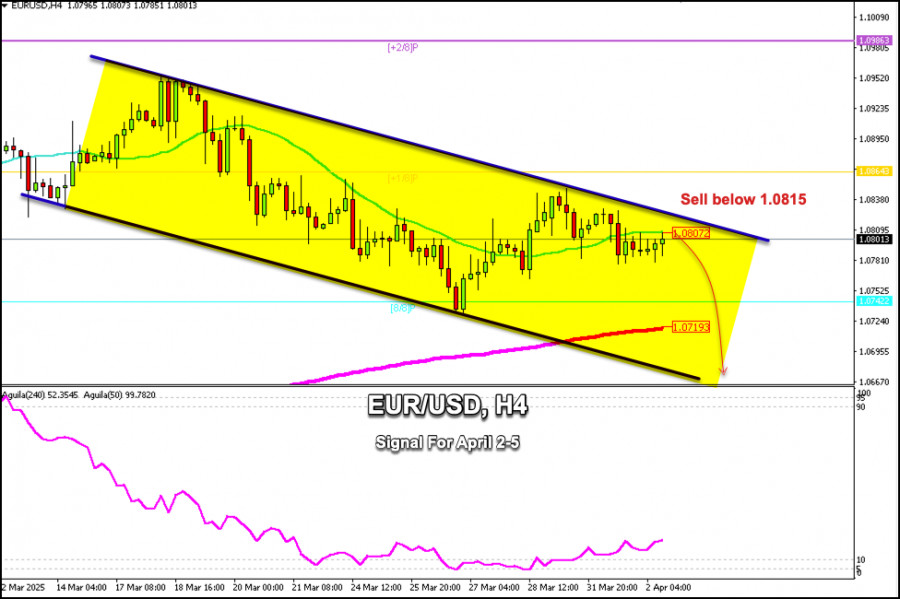
Technical analysisTrading Signals for EUR/USD for April 2-5, 2025: sell below 1.0815 (21 SMA - +1/8 Murray)
If the euro breaks and consolidates above the bearish trend channel, we could expect it to reach +1/8 Murray level at 1.0864 in the coming days. EUR/USD could even reach +2/8 Murray level located at 1.0986.Author: Dimitrios Zappas
15:18 2025-04-02 UTC+2
763
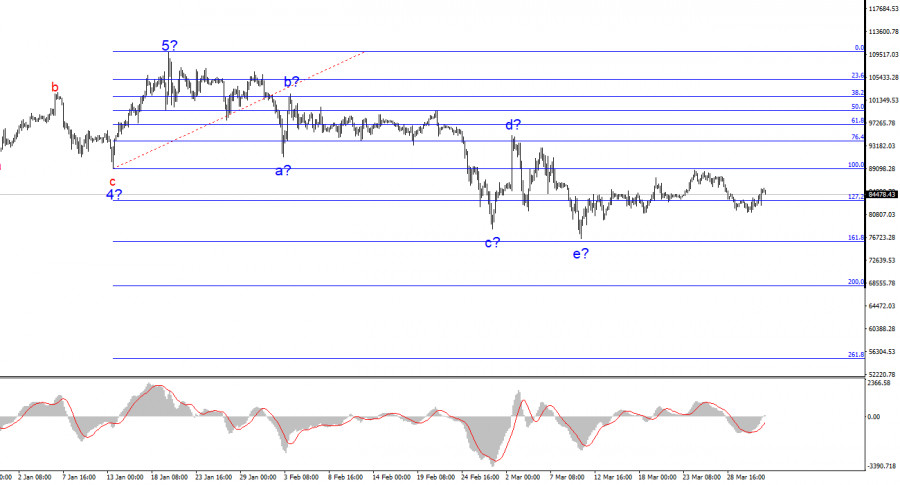
The BTC/USD pair managed to halt its decline, and the current wave structure suggests a potential rise in the world's leading cryptocurrency.Author: Chin Zhao
12:17 2025-04-02 UTC+2
748
- Forecast for EUR/USD on April 2, 2025
Author: Samir Klishi
11:23 2025-04-02 UTC+2
1033
- XAU/USD. Analysis and Forecast
Author: Irina Yanina
13:22 2025-04-02 UTC+2
958
- Technical analysis of EUR/USD, USD/JPY, USDX and Bitcoin.
Author: Sebastian Seliga
11:34 2025-04-02 UTC+2
913
- Today, the AUD/USD pair is showing positive momentum, rebounding from nearly a four-week low.
Author: Irina Yanina
12:25 2025-04-02 UTC+2
913
- Technical analysis
Trading Signals for GOLD (XAU/USD) for April 2-5, 2025: sell below $3,140 or buy above $3,110 (21 SMA - symmetrical triangle)
The symmetrical triangle pattern observed on the H4 chart shows that gold could experience a strong bullish impulse to reach 3,169, where resistance R_1 is located. Below this area, a technical correction could occur.Author: Dimitrios Zappas
15:15 2025-04-02 UTC+2
913
- Today the USD/CAD pair is attempting to halt yesterday's decline, trying to hold above the 1.4300 level.
Author: Irina Yanina
12:22 2025-04-02 UTC+2
898
- Technical analysis
Trading Signals for EUR/USD for April 2-5, 2025: sell below 1.0815 (21 SMA - +1/8 Murray)
If the euro breaks and consolidates above the bearish trend channel, we could expect it to reach +1/8 Murray level at 1.0864 in the coming days. EUR/USD could even reach +2/8 Murray level located at 1.0986.Author: Dimitrios Zappas
15:18 2025-04-02 UTC+2
763
- The BTC/USD pair managed to halt its decline, and the current wave structure suggests a potential rise in the world's leading cryptocurrency.
Author: Chin Zhao
12:17 2025-04-02 UTC+2
748


