Patrones actuales

Los patrones son modelos gráficos que se forman en el gráfico mediante el precio. Según uno de los postulados del análisis técnico, la historia (movimiento del precio) se repite. Esto quiere decir que los movimientos del precio a menudo son similares en las mismas situaciones que hacen posible pronosticar el futuro desarrollo de la situación con una alta probabilidad.
Los patrones relevantes de InstaTrade son un servicio fácil de utilizar que permiten que conozca los últimos cambios en el mercado y reaccione a las pistas del mercado a tiempo. En nuestro servicio, siempre encontrará los últimos y más importantes patrones en cualquier par y en cualquier marco de tiempo.
Bullish Symmetrical Triangle
was formed on 21.03 at 04:06:31 (UTC+0)
signal strength 1 of 5
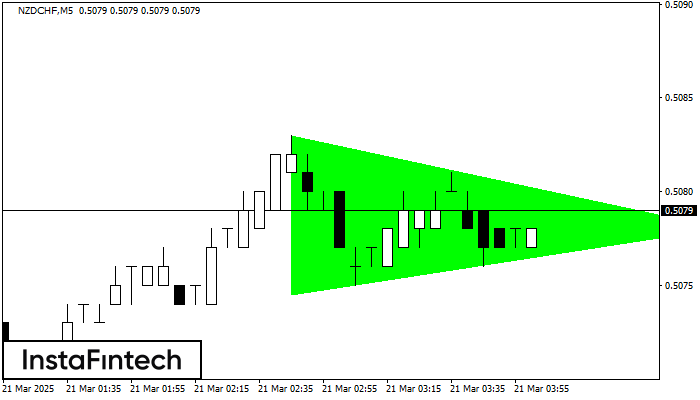
According to the chart of M5, NZDCHF formed the Bullish Symmetrical Triangle pattern. Description: This is the pattern of a trend continuation. 0.5083 and 0.5075 are the coordinates of the upper and lower borders respectively. The pattern width is measured on the chart at 8 pips. Outlook: If the upper border 0.5083 is broken, the price is likely to continue its move by 0.5093.
The M5 and M15 time frames may have more false entry points.
Vea asimismo
- All
- All
- Bearish Rectangle
- Bearish Symmetrical Triangle
- Bearish Symmetrical Triangle
- Bullish Rectangle
- Double Top
- Double Top
- Triple Bottom
- Triple Bottom
- Triple Top
- Triple Top
- All
- All
- Buy
- Sale
- All
- 1
- 2
- 3
- 4
- 5
Triple Piso
was formed on 28.03 at 13:10:00 (UTC+0)
signal strength 1 of 5
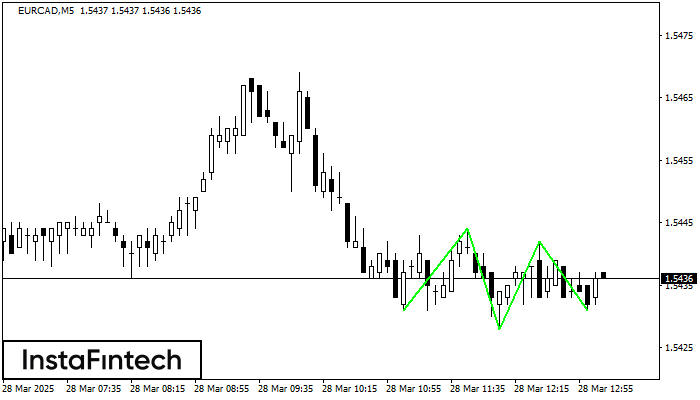
El patrón Triple Piso ha sido formado en el gráfico de EURCAD M5. Características del patrón: línea inferior del patrón tiene coordenadas 1.5444 con el límite superior 1.5444/1.5442, la proyección
Los marcos de tiempo M5 y M15 pueden tener más puntos de entrada falsos.
Open chart in a new window
Triángulo Simétrico Bajista
was formed on 28.03 at 13:02:25 (UTC+0)
signal strength 2 of 5
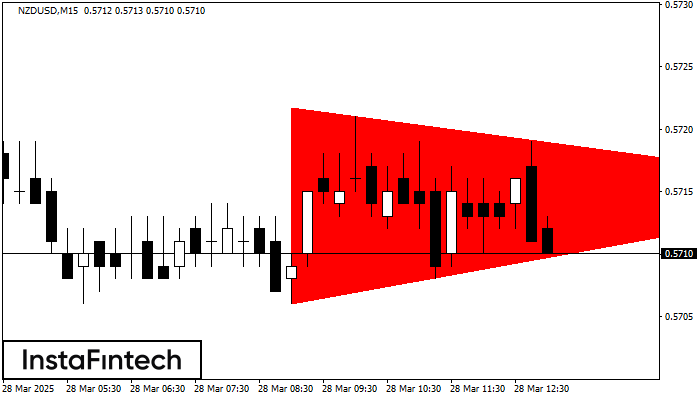
Según el gráfico de M15, el NZDUSD formó el patrón Triángulo Simétrico Bajista. Este patrón señala una tendencia bajista en caso de que el límite inferior 0.5706 sea roto. Aquí
Los marcos de tiempo M5 y M15 pueden tener más puntos de entrada falsos.
Open chart in a new window
Cabeza y Hombros
was formed on 28.03 at 12:14:49 (UTC+0)
signal strength 2 of 5
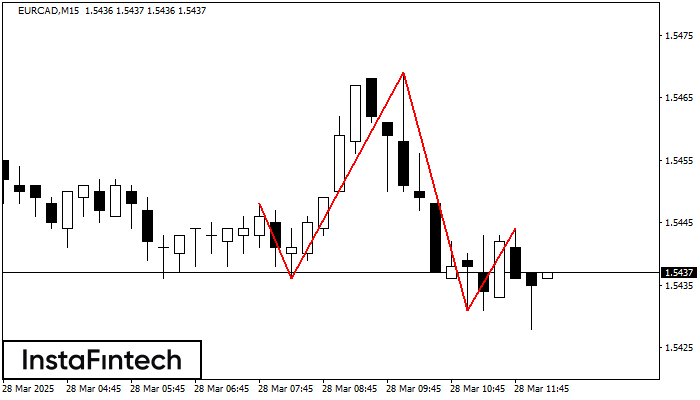
El patrón técnico llamado Cabeza y Hombros ha aparecido en el gráfico de EURCAD M15. Existen razones poderosas para sugerir que el precio superará la línea de cuello 1.5436/1.5431 después
Los marcos de tiempo M5 y M15 pueden tener más puntos de entrada falsos.
Open chart in a new window