Patrones actuales

Los patrones son modelos gráficos que se forman en el gráfico mediante el precio. Según uno de los postulados del análisis técnico, la historia (movimiento del precio) se repite. Esto quiere decir que los movimientos del precio a menudo son similares en las mismas situaciones que hacen posible pronosticar el futuro desarrollo de la situación con una alta probabilidad.
Los patrones relevantes de InstaTrade son un servicio fácil de utilizar que permiten que conozca los últimos cambios en el mercado y reaccione a las pistas del mercado a tiempo. En nuestro servicio, siempre encontrará los últimos y más importantes patrones en cualquier par y en cualquier marco de tiempo.
Head and Shoulders
was formed on 21.03 at 05:06:39 (UTC+0)
signal strength 1 of 5
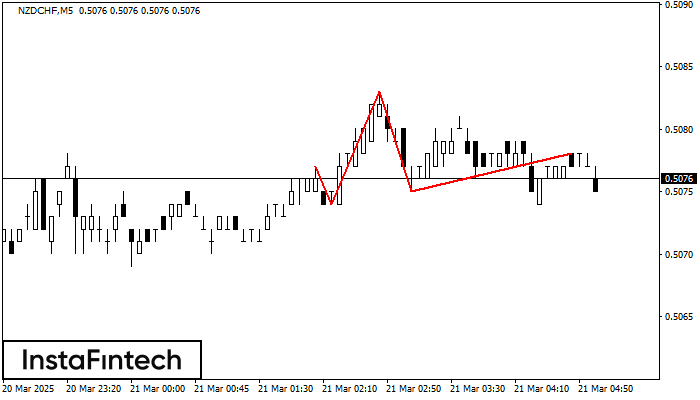
The NZDCHF M5 formed the Head and Shoulders pattern with the following features: The Head’s top is at 0.5083, the Neckline and the upward angle are at 0.5074/0.5075. The formation of this pattern can bring about changes in the current trend from bullish to bearish. In case the pattern triggers the expected changes, the price of NZDCHF will go towards 0.5060.
The M5 and M15 time frames may have more false entry points.
Vea asimismo
- All
- All
- Bearish Rectangle
- Bearish Symmetrical Triangle
- Bearish Symmetrical Triangle
- Bullish Rectangle
- Double Top
- Double Top
- Triple Bottom
- Triple Bottom
- Triple Top
- Triple Top
- All
- All
- Buy
- Sale
- All
- 1
- 2
- 3
- 4
- 5
Doble Piso
was formed on 28.03 at 05:30:51 (UTC+0)
signal strength 1 of 5
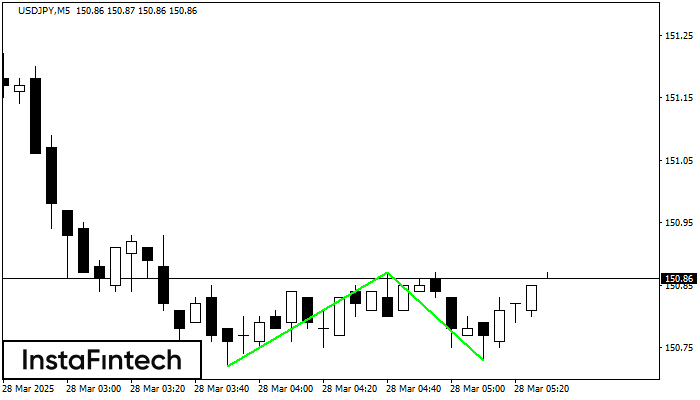
El patrón Doble Piso ha sido formado en USDJPY M5. Características: el nivel de soporte 150.72; el nivel de resistencia 150.87; el ancho del patrón 15 puntos. Si el nivel
Los marcos de tiempo M5 y M15 pueden tener más puntos de entrada falsos.
Open chart in a new window
Triángulo Simétrico Bajista
was formed on 28.03 at 04:36:48 (UTC+0)
signal strength 1 of 5
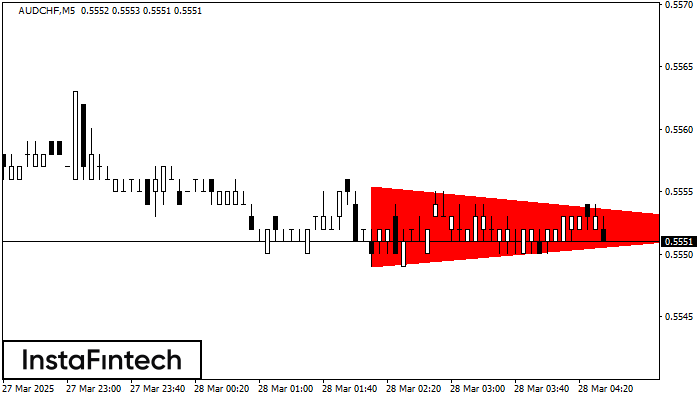
Según el gráfico de M5, el AUDCHF formó el patrón Triángulo Simétrico Bajista. Recomendaciones de negociación: es posible que una ruptura del límite inferior 0.5549 fomente una continuación
Los marcos de tiempo M5 y M15 pueden tener más puntos de entrada falsos.
Open chart in a new window
Bandera bajista
was formed on 28.03 at 03:22:22 (UTC+0)
signal strength 1 of 5
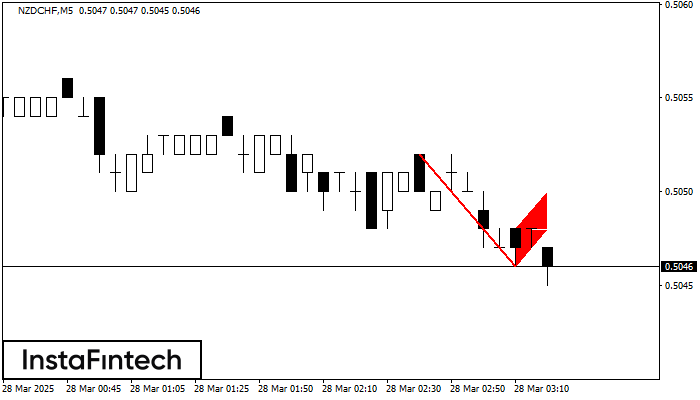
El patrón Bandera bajista ha sido formado en el gráfico NZDCHF M5. Por consiguiente, es probable que la tendencia bajista continúe a corto plazo. Tan pronto el precio rompa
Los marcos de tiempo M5 y M15 pueden tener más puntos de entrada falsos.
Open chart in a new window