Patrones actuales

Los patrones son modelos gráficos que se forman en el gráfico mediante el precio. Según uno de los postulados del análisis técnico, la historia (movimiento del precio) se repite. Esto quiere decir que los movimientos del precio a menudo son similares en las mismas situaciones que hacen posible pronosticar el futuro desarrollo de la situación con una alta probabilidad.
Los patrones relevantes de InstaTrade son un servicio fácil de utilizar que permiten que conozca los últimos cambios en el mercado y reaccione a las pistas del mercado a tiempo. En nuestro servicio, siempre encontrará los últimos y más importantes patrones en cualquier par y en cualquier marco de tiempo.
Triple Top
was formed on 21.03 at 05:31:56 (UTC+0)
signal strength 3 of 5
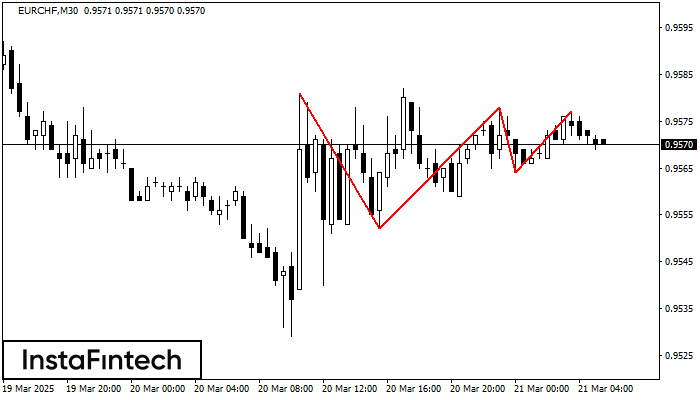
On the chart of the EURCHF M30 trading instrument, the Triple Top pattern that signals a trend change has formed. It is possible that after formation of the third peak, the price will try to break through the resistance level 0.9552, where we advise to open a trading position for sale. Take profit is the projection of the pattern’s width, which is 29 points.
Vea asimismo
- All
- All
- Bearish Rectangle
- Bearish Symmetrical Triangle
- Bearish Symmetrical Triangle
- Bullish Rectangle
- Double Top
- Double Top
- Triple Bottom
- Triple Bottom
- Triple Top
- Triple Top
- All
- All
- Buy
- Sale
- All
- 1
- 2
- 3
- 4
- 5
Fundo duplo
was formed on 28.03 at 05:30:51 (UTC+0)
signal strength 1 of 5
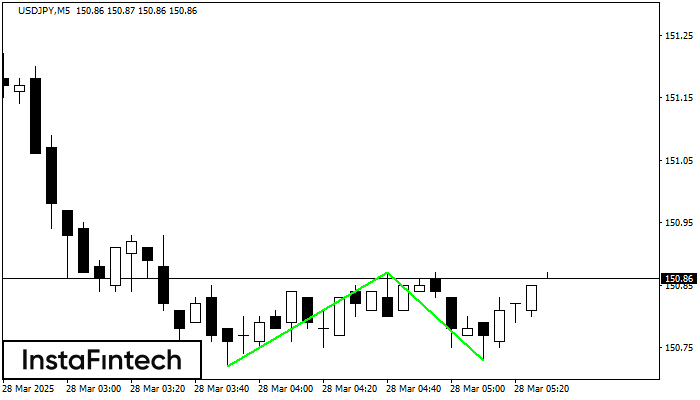
O padrão Fundo duplo foi formado em USDJPY M5. Características: o nível de suporte 150.72; o nível de resistência 150.87; a largura do padrão 15 pontos. Se o nível
Os intervalos M5 e M15 podem ter mais pontos de entrada falsos.
Open chart in a new window
Triângulo Simétrico de Baixa
was formed on 28.03 at 04:36:48 (UTC+0)
signal strength 1 of 5
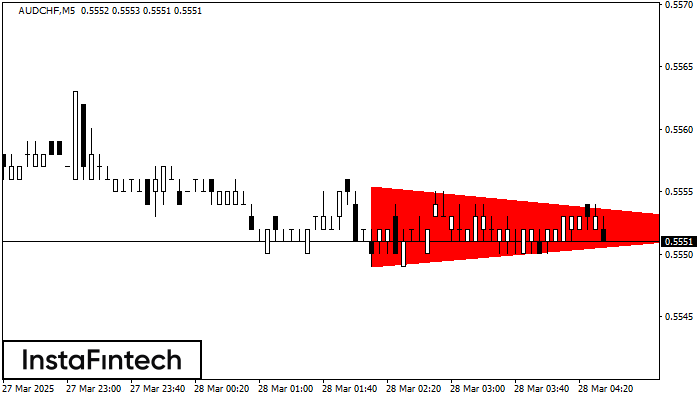
De acordo com o gráfico de M5, AUDCHF formou o padrão de Triângulo Simétrico de Baixa. Recomendações de negociação: Uma quebra do limite inferior de 0.5549 pode encorajar a continuação
Os intervalos M5 e M15 podem ter mais pontos de entrada falsos.
Open chart in a new window
Bandeira de Baixa
was formed on 28.03 at 03:22:22 (UTC+0)
signal strength 1 of 5
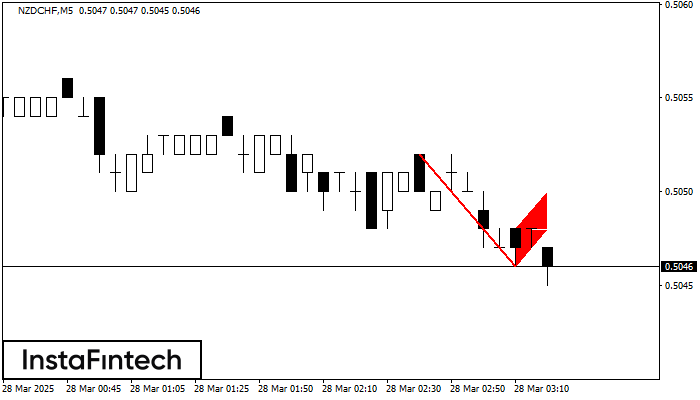
O padrão Bandeira de Baixa foi formado no gráfico NZDCHF M5. Portanto, é provável que a tendência de queda continue a curto prazo. Assim que o preço cair abaixo
Os intervalos M5 e M15 podem ter mais pontos de entrada falsos.
Open chart in a new window