

Patrones actuales

Los patrones son modelos gráficos que se forman en el gráfico mediante el precio. Según uno de los postulados del análisis técnico, la historia (movimiento del precio) se repite. Esto quiere decir que los movimientos del precio a menudo son similares en las mismas situaciones que hacen posible pronosticar el futuro desarrollo de la situación con una alta probabilidad.
Los patrones relevantes de InstaTrade son un servicio fácil de utilizar que permiten que conozca los últimos cambios en el mercado y reaccione a las pistas del mercado a tiempo. En nuestro servicio, siempre encontrará los últimos y más importantes patrones en cualquier par y en cualquier marco de tiempo.
Head and Shoulders
was formed on 25.03 at 04:50:35 (UTC+0)
signal strength 1 of 5

The technical pattern called Head and Shoulders has appeared on the chart of AUDJPY M5. There are weighty reasons to suggest that the price will surpass the Neckline 94.62/94.62 after the right shoulder has been formed. So, the trend is set to change with the price heading for 94.47.
The M5 and M15 time frames may have more false entry points.
Vea asimismo
- All
- All
- Bearish Rectangle
- Bearish Symmetrical Triangle
- Bearish Symmetrical Triangle
- Bullish Rectangle
- Double Top
- Double Top
- Triple Bottom
- Triple Bottom
- Triple Top
- Triple Top
- All
- All
- Buy
- Sale
- All
- 1
- 2
- 3
- 4
- 5
Doble Techo
was formed on 27.03 at 02:00:33 (UTC+0)
signal strength 2 of 5
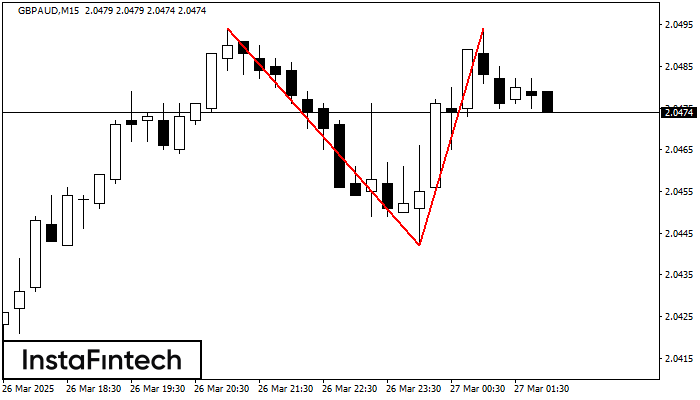
El patrón Doble Techo ha sido formado en GBPAUD M15. Esto señala que la tendencia ha sido cambiada de alcista a bajista. Probablemente, si la base del patrón 2.0442
Los marcos de tiempo M5 y M15 pueden tener más puntos de entrada falsos.
Open chart in a new window
Triángulo Simétrico Alcista
was formed on 27.03 at 01:21:01 (UTC+0)
signal strength 1 of 5
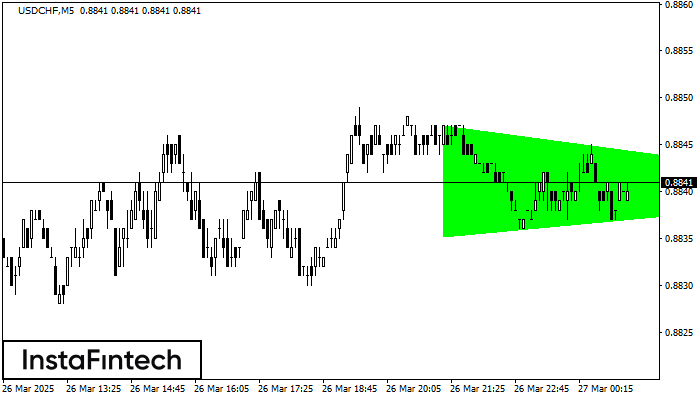
Según el gráfico de M5, USDCHF formó el patrón Triángulo Simétrico Alcista. Descripción: Este es el patrón de la continuación de una tendencia. 0.8847 y 0.8835 son las coordenadas
Los marcos de tiempo M5 y M15 pueden tener más puntos de entrada falsos.
Open chart in a new window
Doble Piso
was formed on 27.03 at 00:00:29 (UTC+0)
signal strength 3 of 5

El patrón Doble Piso ha sido formado en NZDCAD M30; el límite superior es 0.8209; el límite inferior es 0.8165. El ancho del patrón es 43 puntos. En caso
Open chart in a new window

