อ่านรายละเอียดเพิ่มเติม


 03.03.2023 08:22 AM
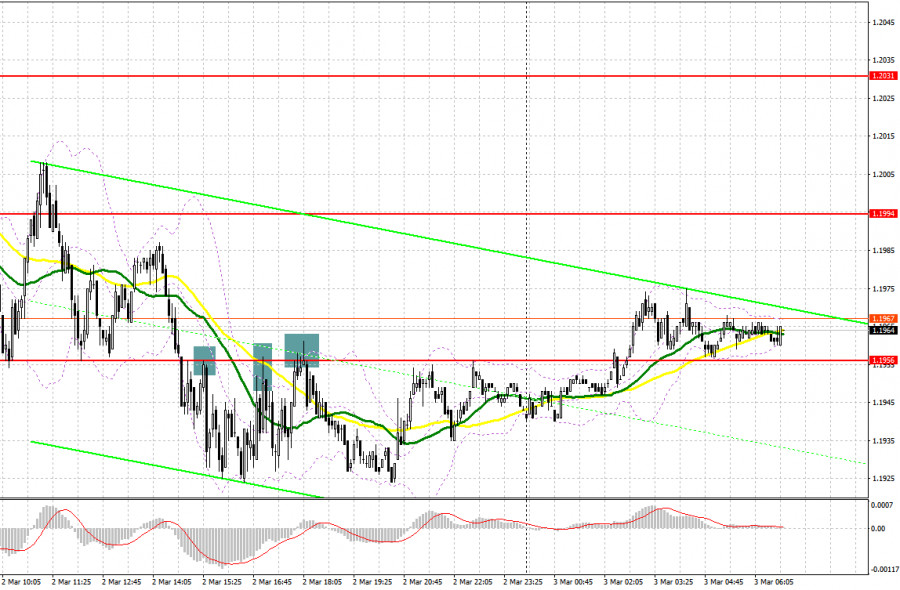
Yesterday, the pair formed several good entry signals. Let's see what happened on the 5-minute chart. In my morning review, I mentioned the level of 1.1970 as a possible entry point. A decline to this level and its false breakout formed a buy signal but the price failed to develop a proper upward movement. In the second half of the day, the pair came under pressure again. It broke through the level of 1.1956 and retested it, thus generating a good sell signal. As a result, the pound dropped by 30 pips. In the New York session, the pair did not form any more entry signals.
For long positions on GBP/USD:
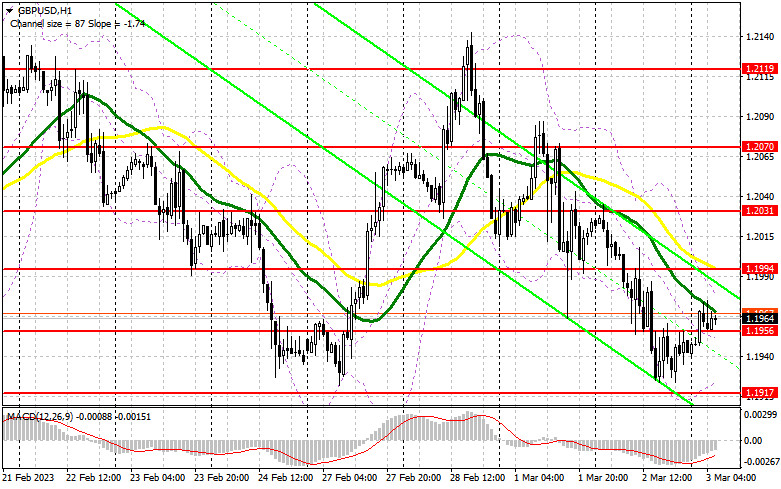
Today, the further trajectory of the pound will fully depend on the UK Services PMI and Markit Composite PMI. Analysts expect to see a rise in these indicators which may potentially help the pound rebound from the monthly lows. Another test of the 1.1917 level may end with a breakout. But before reaching 1.1917, bulls may assert their strength at the interim support of 1.1956. A false breakout at this level following a strong report on services PMI will form a buy signal that may develop into an upside correction to the area of 1.1994, an interim resistance where moving averages support the bears. I will bet on the pair's further rise to the high of 1.2031 only if the price settles at 1.1994 and retests it from top to bottom. If the price breaks above 1.2031, it may head for the next upward target at 1.2070 where I'm going to take profit. If bulls fail to open positions at 1.1956 in the first half of the day under strong selling pressure, bears will act more aggressively and may resume the downtrend. If so, you should open long positions only at the next support of 1.1917 and only in case of a false breakout. I will buy GBP/USD right after a rebound from the low of 1.1875, keeping in mind an intraday correction of 30-35 pips.
For short positions on GBP/USD:
Bears reached all their targets yesterday and continue to exert pressure on the pound to take full control of the market. To develop a stronger movement, they need to protect the nearest resistance of 1.1994 and gain control of the interim support level at 1.1956 that was formed at the close of yesterday's session. A rise to 1.1994 and ist false breakout in the first half of the day following the strong PMI data will act as a great sell signal that may push GBP/USD to the nearest support area of 1.1956. Its breakout and a retest will cancel the plan of the bulls to develop an upside correction. So, bears and large market players will increase their presence in the market, forming a good sell signal with the target at 1.1917 where the price has headed for the fourth time. The level of 1.1875 will serve as the lowest target where I'm going to take profit. If GBP/USD rises and bears are idle at 1.1994, bulls will enter the market again. In this case, bears will retreat until a false breakout at the next resistance of 1.2031 creates an entry point into short positions. If nothing happens there as well, I will sell GBP/USD right from the high of 1.2070, considering a pullback of 30-35 pips within the day.
COT report:
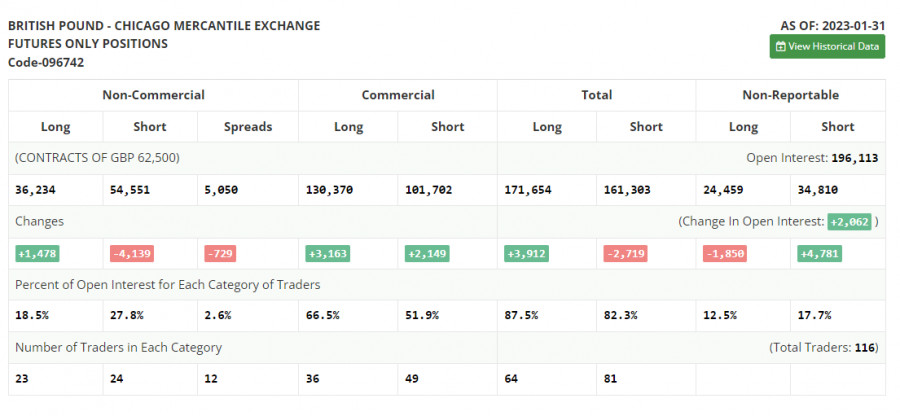
The Commitments of Traders report for January 31 recorded a rise in long positions and a drop in the short ones. Apparently, traders were betting on further rate hikes by the Bank of England and preferred to leave the market before the policy meeting. However, this data is not of big importance at the moment. After a cyber attack on the CFTC, fresh figures are not out yet so the data from a month ago is actually not that relevant. Let's wait for new COT reports to get a better understanding of the market. This week, we don't expect any key economic reports from the US which means that pressure on risk assets may finally ease. In theory, this may allow the pound to develop an upside correction against the US dollar. According to the latest COT report, short positions of the non-commercial group of traders decreased by 4,139 to 54,551, while long positions rose by 1,478 to 36,234. As a result, the negative value of the non-commercial net position decreased to -18,317 from -23,934 recorded a week ago. The weekly closing price declined to 1.2333 from 1.2350.
Indicator signals:
Moving Averages
Trading below the 30- and 50-day moving averages indicates that bears are trying to regain control.
Please note that the time period and levels of the moving averages are analyzed only for the H1 chart, which differs from the general definition of the classic daily moving averages on the D1 chart.
Bollinger Bands
If the pair advances, the upper band of the indicator at 1.1975 will serve as resistance. In case of a decline, the lower band of the indicator at 1.1920 will act as support.
Description of indicators:
• A moving average of a 50-day period determines the current trend by smoothing volatility and noise; marked in yellow on the chart;
• A moving average of a 30-day period determines the current trend by smoothing volatility and noise; marked in green on the chart;
• MACD Indicator (Moving Average Convergence/Divergence) Fast EMA with a 12-day period; Slow EMA with a 26-day period. SMA with a 9-day period;
• Bollinger Bands: 20-day period;
• Non-commercial traders are speculators such as individual traders, hedge funds, and large institutions who use the futures market for speculative purposes and meet certain requirements;
• Long non-commercial positions represent the total number of long positions opened by non-commercial traders;
• Short non-commercial positions represent the total number of short positions opened by non-commercial traders;
• The non-commercial net position is the difference between short and long positions of non-commercial traders.
You have already liked this post today
*บทวิเคราะห์ในตลาดที่มีการโพสต์ตรงนี้ เพียงเพื่อทำให้คุณทราบถึงข้อมูล ไม่ได้เป็นการเจาะจงถึงขั้นตอนให้คุณทำการซื้อขายตาม
ในบทวิเคราะห์เช้าของฉัน ฉันได้เน้นที่ระดับ 1.3293 และมีแผนที่จะใช้เป็นจุดอ้างอิงสำหรับการเข้าตลาด ลองดูกราฟ 5 นาทีและวิเคราะห์สิ่งที่เกิดขึ้น การทะลุและการทดสอบที่ระดับ 1.3239 ได้ให้จุดเข้าไปในตำแหน่งซื้อ ซึ่งส่งผลให้เกิดการขึ้นมากกว่า 20 จุด แม้ว่าคู่เงินจะยังไม่ถึงระดับเป้าหมายก็ตาม แนวโน้มทางเทคนิคได้รับการปรับปรุงในครึ่งหลังของวัน
ในการวิเคราะห์เมื่อเช้านี้ ฉันได้มุ่งเน้นไปที่ระดับ 1.1358 และวางแผนในการตัดสินใจซื้อขายบนพื้นฐานนี้ มาดูที่กราฟ 5 นาทีเพื่อทำความเข้าใจว่าเกิดอะไรขึ้น คู่สกุลเงินได้เพิ่มขึ้นแต่ก็ไม่ได้ถึงระดับ 1.1358 ดังนั้นฉันจึงไม่ได้ทำการซื้อขาย ภาพรวมทางเทคนิคได้มีการปรับปรุงใหม่สำหรับช่วงบ่ายของวัน วิธีเปิดสถานะซื้อใน EUR/USD: ข้อมูล
เมื่อวันพุธ คู่เงิน GBP/USD เคลื่อนไหวอย่างใกล้ชิดกับคู่เงิน EUR/USD ยืนยันเพิ่มว่าในสถานการณ์ปัจจุบันขึ้นอยู่กับค่าเงินดอลลาร์สหรัฐทั้งหมด ซึ่งชะตากรรมของค่าเงินดอลลาร์สหรัฐขึ้นอยู่กับน้ำพระทัยของ Donald Trump เกือบทุกการเคลื่อนไหวในตลาดไม่ทางใดก็ทางหนึ่งถูกกระตุ้นจากคำแถลงของประธานาธิบดีสหรัฐสตรีเพียงคนเดียว อาจจะดูเหมือนไม่น่าสนใจเลยเพราะพูดแต่เรื่องของ Trump แต่จะพูดถึงปัจจัยอื่นไปทำไมถ้ามันไม่ได้ส่งผลกระทบต่อการเคลื่อนไหวของราคา เมื่อวานนี้ ดัชนีความเคลื่อนไหวทางธุรกิจเดือนเมษายนในภาคการบริการและการผลิตถูกเผยแพร่ทั้งในสหราชอาณาจักรและสหรัฐอเมริกา
ในวันพุธ คู่สกุลเงิน EUR/USD มีการซื้อขายแบบผสมผสาน ระหว่างวัน ราคามีการเปลี่ยนทิศทางหลายครั้ง และข้อมูลเศรษฐกิจมหภาคไม่ได้เป็นตัวกระตุ้นให้เกิดการกลับตัวเหล่านี้ ตลาดยังคงอยู่ในภาวะไม่สงบและมีข่าวมากมายออกมาจากทำเนียบขาว ในมุมมองของเรา ข้อมูลส่วนใหญ่จาก Donald Trump นั้นไม่คุ้มค่าที่จะให้ความสนใจ อย่างไรก็ตาม ดูเหมือนเทรดเดอร์จะคิดต่างออกไป
เมื่อวันพุธ, คู่สกุลเงิน GBP/USD ได้เคลื่อนไปในทิศทางเดียวกันกับคู่สกุลเงิน EUR/USD. เงินปอนด์อังกฤษได้ลดลงอย่างแรงในช่วงกลางคืนหลังจากมีคำแถลงจาก Donald Trump สองครั้ง จากนั้นก็ฟื้นตัวขึ้นมาอย่างรวดเร็ว ก่อนจะตกลงอีกครั้ง. สิ่งที่ควรสังเกตคือ ในครึ่งแรกของวัน เงินปอนด์ส่วนใหญ่จะปรับตัวสูงขึ้น ถึงแม้ว่าข้อมูลเศรษฐกิจมหภาค
คู่สกุลเงิน EUR/USD มีการซื้อขายกลับไปกลับมาตลอดทั้งวันพุธ โดยปรับเปลี่ยนเส้นทางอยู่ตลอดเวลา วันซื้อขายเริ่มต้นด้วยการร่วงลงของราคาเนื่องจากการประกาศของ Donald Trump ว่าเขาจะไม่ปลด Jerome Powell เราจะข้ามเรื่องที่ว่า Trump ไม่มีอำนาจในการปลด Powell
ในการพยากรณ์ช่วงเช้าของฉัน ฉันได้เน้นที่ระดับ 1.3304 และวางแผนที่จะตัดสินใจเข้าสู่ตลาดจากระดับนั้น มาดูกราฟ 5 นาทีและวิเคราะห์สิ่งที่เกิดขึ้นกัน การขึ้นและการทดสอบผิดพลาดรอบระดับ 1.3304 นั้นเปิดโอกาสให้สำหรับตำแหน่งขาลง แต่คู่เงินนั้นไม่ได้มีการตกลงอย่างมีนัย อย่างไรก็ตาม แนวโน้มทางเทคนิคได้ถูกปรับปรุงสำหรับช่วงครึ่งหลังของวัน ข้อมูลดัชนี
ในพยากรณ์ช่วงเช้าของฉัน ฉันได้เน้นถึงระดับ 1.1412 และวางแผนที่จะทำการตัดสินใจด้านการซื้อขายจากระดับนั้น มาวิเคราะห์แผนภูมิ 5 นาทีและดูสิ่งที่เกิดขึ้น การเพิ่มขึ้นและการเกิด false breakout ใกล้บริเวณ 1.1412 ให้จุดเข้าเพื่อลงทุนขายเงินยูโรได้ดี อย่างไรก็ตาม คู่สกุลเงินนี้ไม่สามารถเห็นการลดลงที่มีนัยสำคัญได้
คู่เงิน GBP/USD ปรับตัวลดลงอย่างมากในวันอังคาร ขณะที่การลดลงของเงินปอนด์เริ่มขึ้นอย่างช้าๆ ในช่วงเย็น Donald Trump ตัดสินใจช่วยค่าเงินดอลลาร์สหรัฐโดยประธานาธิบดีสหรัฐฯ กล่าวว่าเขาไม่มีเจตนาจะไล่ Jerome Powell ออก และไม่ได้วางแผนที่จะเก็บภาษี 145% กับจีนไว้นานๆ
คู่สกุลเงิน EUR/USD มีการลดลงอย่างมีนัยสำคัญในวันอังคารที่ผ่านมา ค่าเงินยูโรลดลงเกือบตลอดทั้งวัน โดยการเคลื่อนไหวมีความเข้มข้นมากขึ้นในช่วงกลางคืน การลดลงนี้มีความรวดเร็วมากขึ้นหลังจากมีการประกาศแถลงการณ์ที่ขัดแย้งจาก Donald Trump โดยในครั้งนี้ ประธานาธิบดีสหรัฐฯ กล่าวว่าเขาได้เปลี่ยนใจเกี่ยวกับการไล่เจ้านายของธนาคารกลางสหรัฐฯ Jerome Powell ออก แม้ว่าเขายังคงตำหนิว่า
สมาชิกInstaForex

Your IP address shows that you are currently located in the USA. If you are a resident of the United States, you are prohibited from using the services of InstaFintech Group including online trading, online transfers, deposit/withdrawal of funds, etc.
If you think you are seeing this message by mistake and your location is not the US, kindly proceed to the website. Otherwise, you must leave the website in order to comply with government restrictions.
Why does your IP address show your location as the USA?
Please confirm whether you are a US resident or not by clicking the relevant button below. If you choose the wrong option, being a US resident, you will not be able to open an account with InstaTrade anyway.
We are sorry for any inconvenience caused by this message.


