อ่านรายละเอียดเพิ่มเติม


 02.10.2023 05:41 PM
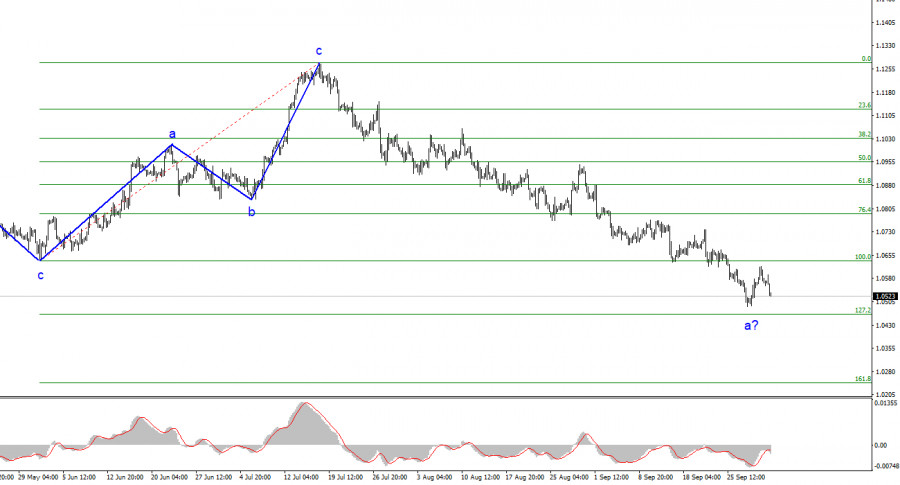
The wave analysis of the 4-hour chart for the euro/dollar pair remains quite clear. Over the past year, we have seen only three wave structures that alternate with each other consistently. Over the past few months, I have regularly mentioned that I expected the pair to be around the 5th figure, from where the construction of the last ascending three-wave structure began. This week, that target was reached. The assumed first wave of the new descending trend segment may continue its formation, although there are currently signs of its completion. These signs are mostly related to the possible completion of the first wave of the British pound.
None of the recent price increases resembled a full-fledged wave 2 or b. Therefore, all of these were internal corrective waves within wave 1 or a. If this is indeed the case, the decline in quotes may continue for some time during this wave. This means that the overall decline of the European currency will not be completed yet, as the construction of the third wave is still required. Within the first wave, five internal waves can already be traced, so its completion is approaching. A successful attempt to break above the level of 1.0637, which is equivalent to 100.0% according to Fibonacci, currently indicates the market's readiness to continue selling the pair with targets located around 1.0463.
The euro is uncertain about how to react to inflation.
The euro/dollar pair's exchange rate fell by 60 basis points on Monday. Demand for the euro continued to decline almost overnight. It started falling on Friday, to be precise. Honestly, I had questions about the pair's decline even on Friday. Today, these questions have neither increased nor decreased. The economic reports released on Monday in the European Union and Germany were, if one could put it this way, "predictably poor." The Business Activity Index in the manufacturing sector of Germany increased in September, but it increased from 39.1 points to 39.6 points. Obviously, such growth is challenging to attribute to the euro's positive factors. The same goes for the Business Activity Index in the manufacturing sector of the entire European Union. The indicator decreased from 43.5 points to 43.4 points. In other words, it remained practically unchanged. The unemployment rate remained unchanged at 6.4%, but the value of the previous month (July) was revised upward to 6.5%.
Based on all of the above, none of the reports had the potential to boost the euro. However, these reports should not have caused a significant decline in the European currency either. Therefore, I believe that the market maintains a "bearish" sentiment and has not yet completed the construction of the descending wave. This is why the demand for the EU currency continues to decline at such a pace. At this rate, the euro may fall much lower than the 5–6 figures I mentioned in recent months.
Based on the analysis conducted, I conclude that the construction of a downward wave set continues. The targets in the range of 1.0500–1.0600 have been ideally worked out, but the decline may continue for some time. Therefore, I continue to recommend selling the pair. Since the descending wave has not completed near the level of 1.0637, we can now expect a decline to the level of 1.0463, which is equivalent to 127.2% according to Fibonacci. However, the second corrective wave will start sooner or later on its own.
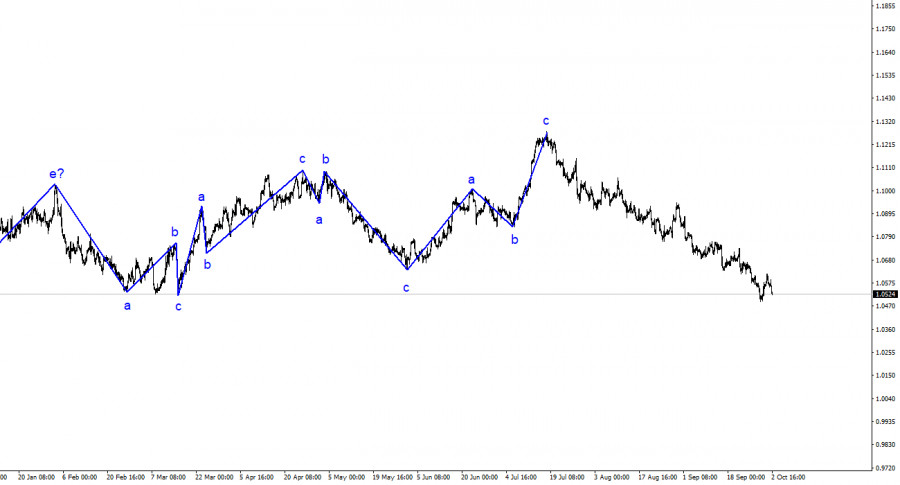
On a larger wave scale, the wave analysis of the ascending trend segment has taken on an extended form, but it is likely completed. We have seen five upward waves, which are most likely the structure of a-b-c-d-e. After that, the pair built four three-wave structures: two downward and two upward. Now, it has probably moved on to the stage of building another extended three-wave descending structure.
You have already liked this post today
*บทวิเคราะห์ในตลาดที่มีการโพสต์ตรงนี้ เพียงเพื่อทำให้คุณทราบถึงข้อมูล ไม่ได้เป็นการเจาะจงถึงขั้นตอนให้คุณทำการซื้อขายตาม
โครงสร้างคลื่นในกราฟ EUR/USD ระยะ 4 ชั่วโมงได้เปลี่ยนเป็นรูปแบบแรงกระตุ้นเชิงบูลลิช ผมเชื่อว่าไม่มีข้อสงสัยว่าการเปลี่ยนแปลงนี้เกิดขึ้นเพียงเพราะนโยบายการค้าของสหรัฐฯ ใหม่ จนถึงวันที่ 28 กุมภาพันธ์ เมื่อเงินดอลลาร์สหรัฐเริ่มลดลงอย่างรวดเร็ว โครงสร้างคลื่นทั้งหมดยังคงสะท้อนรูปแบบขาลงที่น่าเชื่อถือ คลื่นแก้ไขที่ 2 กำลังดำเนินไป
คู่สกุลเงิน GBP/USD ยังคงปราศจากการเปลี่ยนแปลงในวันพฤหัสบดี แม้จะเป็นพฤติกรรมของตลาดที่อาจคาดหวังได้สำหรับวันพฤหัสบดี แต่ค่อนข้างน่าแปลกใจที่ไม่เห็นการปรับตัวลงในวันพุธ ทั้งที่มีเหตุผลพื้นฐานหลายประการสนับสนุน รูปแบบคลื่นสำหรับ GBP/USD ก็ได้เปลี่ยนแปลงไปเป็นโครงสร้างขาขึ้นเชิงบวก — "ขอบคุณ" กับ Donald Trump รูปแบบคลื่นที่เกิดขึ้นนี้เกือบจะเหมือนกับของคู่สกุลเงิน
โครงสร้างคลื่นบนแผนภูมิ 4 ชั่วโมงสำหรับคู่ EUR/USD ได้เปลี่ยนไปเป็นรูปแบบวาซาว (bullish). ผมคิดว่าน่าจะไม่มีความสงสัยว่าการเปลี่ยนแปลงดังกล่าวเกิดขึ้นโดยสมบูรณ์เพราะนโยบายการค้าใหม่ของสหรัฐฯ จนถึงวันที่ 28 กุมภาพันธ์ — เมื่อเริ่มต้นแนวโน้มที่ร่วงตัวของดอลลาร์สหรัฐฯ — ทั้งหมดของรูปแบบคลื่นดูเหมือนจะเป็นแนวโน้มขาลงที่คงที่ คลื่นแก้ไขลำดับที่
โครงสร้างคลื่นของคู่เงิน GBP/USD ได้เปลี่ยนไปเป็นโครงสร้างขาขึ้นที่มีลักษณะของการพุ่งตัวขึ้นอย่างรุนแรง ซึ่งทั้งหมดนี้ต้องขอบคุณ Donald Trump รูปแบบคลื่นนี้มีลักษณะคล้ายกับ EUR/USD จนถึงวันที่ 28 กุมภาพันธ์ เราได้เห็นโครงสร้างการปรับตัวที่น่าเชื่อถือที่ไม่มีความกังวลใดๆ อย่างไรก็ตาม ความต้องการในเงินดอลลาร์สหรัฐลดลงอย่างรวดเร็ว จนในที่สุดได้ก่อเกิดโครงสร้างคลื่นขาขึ้นห้าคลื่น
ส่วนโครงสร้างคลื่นในกรอบเวลา 4 ชั่วโมงของ EUR/USD ได้ปรับเปลี่ยนกลายเป็นรูปแบบขาขึ้น ข้าพเจ้าเชื่อว่าแทบไม่มีข้อสงสัยเลยว่าการเปลี่ยนแปลงนี้เกิดจากนโยบายการค้าใหม่ของสหรัฐอเมริกาอย่างสิ้นเชิง จนถึงวันที่ 28 กุมภาพันธ์ — เมื่อค่าเงินดอลลาร์ของสหรัฐฯ เริ่มลดลงอย่างชัดเจน — รูปแบบคลื่นทั้งหมดดูคล้ายกับแนวโน้มขาลงที่ชัดเจน คลื่นการแก้ไข
โครงสร้างของคลื่นสำหรับ GBP/USD ได้เปลี่ยนแปลงเป็นรูปแบบขาขึ้นแบบแรงกระทบ — "ขอบคุณ" Donald Trump รูปแบบของคลื่นแทบจะเหมือนกับ EUR/USD จนถึงวันที่ 28 กุมภาพันธ์ เราเห็นการก่อสร้างของโครงสร้างการแก้ไขที่น่าเชื่อถือที่ไม่ได้สร้างความกังวลอะไร อย่างไรก็ตาม ความต้องการสำหรับดอลลาร์สหรัฐเริ่มลดลงอย่างรวดเร็ว
โครงสร้างคลื่นของคู่สกุลเงิน GBP/USD ได้ปรับเข้าสู่รูปแบบขาขึ้นที่มีแรงผลักดัน— ขอบคุณ Donald Trump รูปแบบคลื่นดูเกือบจะเหมือนกับ EUR/USD จนกระทั่งวันที่ 28 กุมภาพันธ์ เราสังเกตเห็นโครงสร้างการปรับตัวที่เชื่อถือได้ซึ่งไม่มีสัญญาณเตือน อย่างไรก็ตาม ความต้องการสกุลเงินสหรัฐฯ ก็เริ่มลดลงอย่างรวดเร็ว
โครงสร้างคลื่นบนกราฟ 4 ชั่วโมงสำหรับคู่ EUR/USD ได้เปลี่ยนมาเป็นรูปแบบขาขึ้นแล้วครับ ผมเชื่อว่าไม่มีข้อสงสัยมากนักว่าการเปลี่ยนแปลงนี้เกิดขึ้นเพียงเพราะนโยบายการค้าใหม่ของสหรัฐอเมริกา ก่อนถึงวันที่ 28 กุมภาพันธ์ เมื่อตลาดเกิดการตกฮวบของค่าดอลลาร์สหรัฐ โครงสร้างคลื่นทั้งหมดมีลักษณะเหมือนแนวโน้มขาลงที่ชัดเจน มันกำลังก่อตัวเป็นคลื่นแก้ไขที่ 2 อย่างไรก็ตามคำประกาศของภาษีต่างๆโดย Trump
GBP/USD การวิเคราะห์: เมื่อดูในกราฟระยะยาวของคู่สกุลเงินหลักของปอนด์สเตอร์ลิง มีแนวโน้มขาขึ้นกำลังก่อตัวขึ้นตั้งแต่เดือนกรกฎาคมของปีที่แล้ว ในเดือนที่ผ่านมา โครงสร้างขนาดใหญ่ที่เป็นรูปคลื่นแบบ flat (B) ได้พัฒนาขึ้นมา โดยราคากำลังไปถึงขอบบนของโซนที่อาจเกิดการกลับตัวบนกราฟรายวัน การคาดการณ์: ในอีกสองสามวันข้างหน้า คาดว่าปอนด์จะเคลื่อนไหวในแนวทางด้านข้าง อาจมีการดึงกลับไปยังโซนสนับสนุนตามด้วยการกลับตัวและเริ่มต้นแนวโน้มขาขึ้นใหม่ แนวต้านที่คำนวณไว้จะทำหน้าที่เป็นขอบบนของการเคลื่อนไหวราคาที่คาดว่าจะเกิดขึ้นภายในสัปดาห์นี้
EUR/USD การวิเคราะห์: บนกราฟ 4 ชั่วโมงของคู่เงินยูโร/ดอลลาร์ การเคลื่อนที่ของแนวโน้มขาขึ้นมีการพัฒนาขึ้นตั้งแต่ต้นเดือนกุมภาพันธ์ โครงสร้างของคลื่นกำลังก่อรูปส่วนสุดท้าย (C) ในช่วงสัปดาห์ที่ผ่านมา ขณะนี้ ราคากำลังเคลื่อนไปถึงขอบเขตของโซนเปลี่ยนทิศทางที่แข็งแกร่งบนกรอบเวลารายวันแล้ว การคาดการณ์: ในสัปดาห์ที่จะถึงนี้ ความผันผวนของราคาถูกคาดว่าจะย้ายไปอยู่ในกรอบด้านข้างเป็นส่วนใหญ่ มีแนวโน้มมากขึ้นว่าการถอยกลับไปสู่ขอบเขตล่างของช่วงราคาจะเกิดขึ้นในครึ่งแรกของสัปดาห์
 InstaFutures
Make money with a new promising instrument!
InstaForex
บัญชี PAMM

Your IP address shows that you are currently located in the USA. If you are a resident of the United States, you are prohibited from using the services of InstaFintech Group including online trading, online transfers, deposit/withdrawal of funds, etc.
If you think you are seeing this message by mistake and your location is not the US, kindly proceed to the website. Otherwise, you must leave the website in order to comply with government restrictions.
Why does your IP address show your location as the USA?
Please confirm whether you are a US resident or not by clicking the relevant button below. If you choose the wrong option, being a US resident, you will not be able to open an account with InstaTrade anyway.
We are sorry for any inconvenience caused by this message.


