รูปแบบกราฟ

รูปแบบกราฟนั้นเป็น รูปจำลองทางกราฟฟิกที่ถูกสร้างขึ้นมาในชาร์ตจากราคา อ้างอิงตามหนึ่งในการวิเคราะห์ทางเทคนิค ที่ตั้งสมมติฐานมาว่า ประวัติศาสตร์ (การเคลื่อนไหวของราคา) มักจะเกิดขึ้นซ้ำรอยเดิม นั้นหมายความว่า การเคลื่อนไหวของราคาก็หมือนกับ สถานการณ์หนึ่งที่จะสามารถทำการคาดการณ์ไปยังทิศทางในอนาคต ตามเหตุการณ์ที่น่าจะมีความเป็นไปได้สูง
รูปแบบกราฟที่สำคัญจากทาง InstaTrade นั้นจะเป็นการบริการที่มีการใช้อย่างง่ายดาย ซึ่งจะช่วยให้คุณสามารถทราบถึงการเปลี่ยนแปลงล่าสุด ในตลาดได้ และสามารถรับมือกับข้อมูลจากทางตลาดได้ทันท่วงที ในการบริการของพวกเรานั้น คุณจะพบกับรูปแบบกราฟล่าสุดและมีความสำคัญมากที่สุดในทุกๆคู่สกุลเงิน และทุกๆขอบเขตเวลา
Bullish Symmetrical Triangle
was formed on 21.03 at 22:36:29 (UTC+0)
signal strength 1 of 5

According to the chart of M5, USDCHF formed the Bullish Symmetrical Triangle pattern. The lower border of the pattern touches the coordinates 0.8825/0.8830 whereas the upper border goes across 0.8835/0.8830. If the Bullish Symmetrical Triangle pattern is in progress, this evidently signals a further upward trend. In other words, in case the scenario comes true, the price of USDCHF will breach the upper border to head for 0.8845.
The M5 and M15 time frames may have more false entry points.
ดูเพิ่มเติม
- All
- All
- Bearish Rectangle
- Bearish Symmetrical Triangle
- Bearish Symmetrical Triangle
- Bullish Rectangle
- Double Top
- Double Top
- Triple Bottom
- Triple Bottom
- Triple Top
- Triple Top
- All
- All
- Buy
- Sale
- All
- 1
- 2
- 3
- 4
- 5
Голова и плечи
сформирован 25.03 в 04:15:36 (UTC+0)
сила сигнала 1 из 5

По USDJPY на M5 сформировалась фигура «Голова и плечи». Вершина головы закреплена на 150.87, при этом средняя линия шеи расположена на 150.68/150.70. Формирование фигуры «Голова и плечи» наиболее вероятным образом
Таймфреймы М5 и М15 могут иметь больше ложных точек входа.
Открыть график инструмента в новом окне
Двойная вершина
сформирован 25.03 в 04:00:34 (UTC+0)
сила сигнала 2 из 5
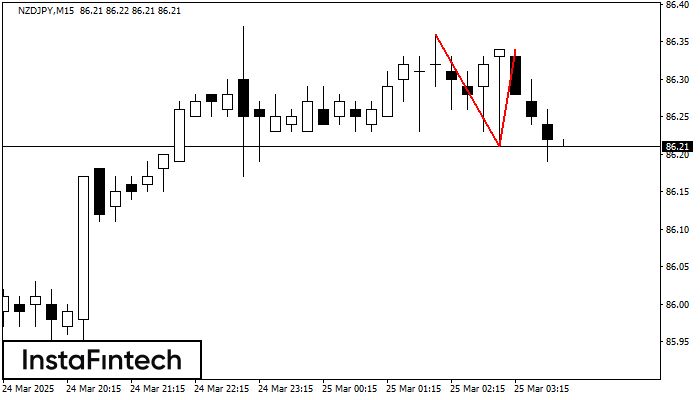
На торговом графике NZDJPY M15 сформировалась разворотная фигура «Двойная вершина». Характеристика: Верхняя граница 86.34; Нижняя граница 86.21; Ширина фигуры 13 пунктов. Сигнал: Пробой нижней границы 86.21 приведет к дальнейшему нисходящему
Таймфреймы М5 и М15 могут иметь больше ложных точек входа.
Открыть график инструмента в новом окне
Тройная вершина
сформирован 25.03 в 03:55:23 (UTC+0)
сила сигнала 1 из 5
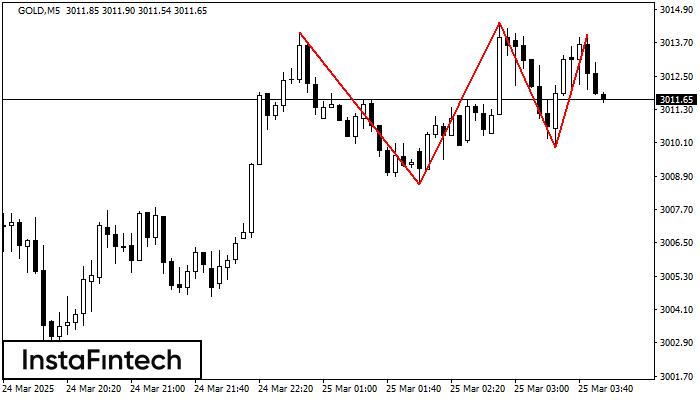
На графике GOLD M5 образовалась фигура «Тройная вершина». Данная фигура относится к типу разворотных и имеет характеристику: Верхняя граница 3014.06/3014.01; Нижняя граница 3008.62/3009.95; Ширина фигуры 449 пунктов. Прогноз: В случае
Таймфреймы М5 и М15 могут иметь больше ложных точек входа.
Открыть график инструмента в новом окне