รูปแบบกราฟ

รูปแบบกราฟนั้นเป็น รูปจำลองทางกราฟฟิกที่ถูกสร้างขึ้นมาในชาร์ตจากราคา อ้างอิงตามหนึ่งในการวิเคราะห์ทางเทคนิค ที่ตั้งสมมติฐานมาว่า ประวัติศาสตร์ (การเคลื่อนไหวของราคา) มักจะเกิดขึ้นซ้ำรอยเดิม นั้นหมายความว่า การเคลื่อนไหวของราคาก็หมือนกับ สถานการณ์หนึ่งที่จะสามารถทำการคาดการณ์ไปยังทิศทางในอนาคต ตามเหตุการณ์ที่น่าจะมีความเป็นไปได้สูง
รูปแบบกราฟที่สำคัญจากทาง InstaTrade นั้นจะเป็นการบริการที่มีการใช้อย่างง่ายดาย ซึ่งจะช่วยให้คุณสามารถทราบถึงการเปลี่ยนแปลงล่าสุด ในตลาดได้ และสามารถรับมือกับข้อมูลจากทางตลาดได้ทันท่วงที ในการบริการของพวกเรานั้น คุณจะพบกับรูปแบบกราฟล่าสุดและมีความสำคัญมากที่สุดในทุกๆคู่สกุลเงิน และทุกๆขอบเขตเวลา
Double Bottom
was formed on 25.03 at 04:45:36 (UTC+0)
signal strength 1 of 5
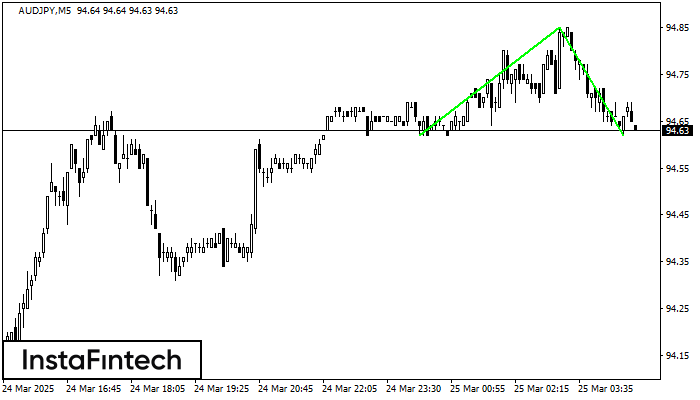
The Double Bottom pattern has been formed on AUDJPY M5; the upper boundary is 94.85; the lower boundary is 94.62. The width of the pattern is 23 points. In case of a break of the upper boundary 94.85, a change in the trend can be predicted where the width of the pattern will coincide with the distance to a possible take profit level.
The M5 and M15 time frames may have more false entry points.
ดูเพิ่มเติม
- All
- All
- Bearish Rectangle
- Bearish Symmetrical Triangle
- Bearish Symmetrical Triangle
- Bullish Rectangle
- Double Top
- Double Top
- Triple Bottom
- Triple Bottom
- Triple Top
- Triple Top
- All
- All
- Buy
- Sale
- All
- 1
- 2
- 3
- 4
- 5
Doble Techo
was formed on 27.03 at 02:00:33 (UTC+0)
signal strength 2 of 5
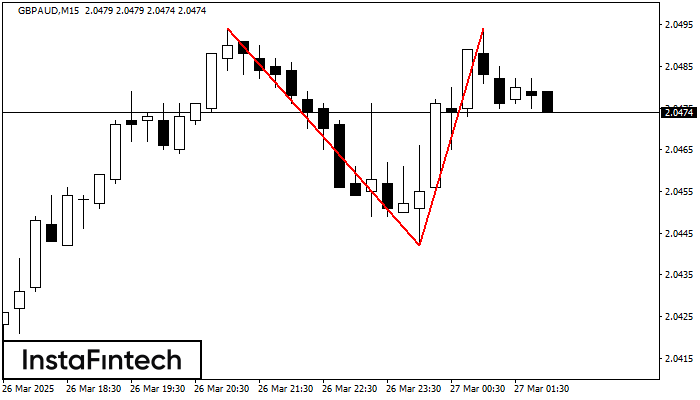
El patrón Doble Techo ha sido formado en GBPAUD M15. Esto señala que la tendencia ha sido cambiada de alcista a bajista. Probablemente, si la base del patrón 2.0442
Los marcos de tiempo M5 y M15 pueden tener más puntos de entrada falsos.
Open chart in a new window
Triángulo Simétrico Alcista
was formed on 27.03 at 01:21:01 (UTC+0)
signal strength 1 of 5
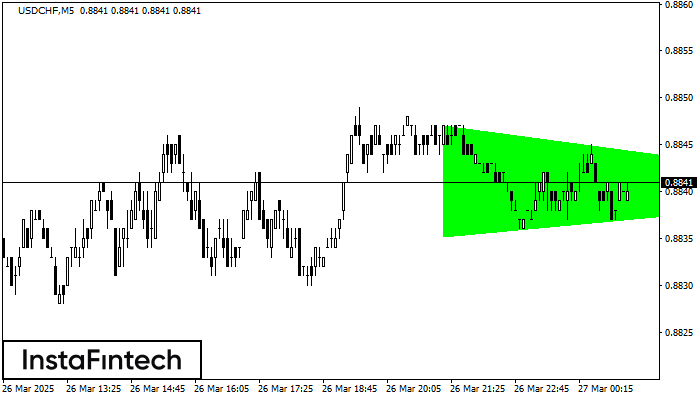
Según el gráfico de M5, USDCHF formó el patrón Triángulo Simétrico Alcista. Descripción: Este es el patrón de la continuación de una tendencia. 0.8847 y 0.8835 son las coordenadas
Los marcos de tiempo M5 y M15 pueden tener más puntos de entrada falsos.
Open chart in a new window
Doble Piso
was formed on 27.03 at 00:00:29 (UTC+0)
signal strength 3 of 5

El patrón Doble Piso ha sido formado en NZDCAD M30; el límite superior es 0.8209; el límite inferior es 0.8165. El ancho del patrón es 43 puntos. En caso
Open chart in a new window