รูปแบบกราฟ

รูปแบบกราฟนั้นเป็น รูปจำลองทางกราฟฟิกที่ถูกสร้างขึ้นมาในชาร์ตจากราคา อ้างอิงตามหนึ่งในการวิเคราะห์ทางเทคนิค ที่ตั้งสมมติฐานมาว่า ประวัติศาสตร์ (การเคลื่อนไหวของราคา) มักจะเกิดขึ้นซ้ำรอยเดิม นั้นหมายความว่า การเคลื่อนไหวของราคาก็หมือนกับ สถานการณ์หนึ่งที่จะสามารถทำการคาดการณ์ไปยังทิศทางในอนาคต ตามเหตุการณ์ที่น่าจะมีความเป็นไปได้สูง
รูปแบบกราฟที่สำคัญจากทาง InstaTrade นั้นจะเป็นการบริการที่มีการใช้อย่างง่ายดาย ซึ่งจะช่วยให้คุณสามารถทราบถึงการเปลี่ยนแปลงล่าสุด ในตลาดได้ และสามารถรับมือกับข้อมูลจากทางตลาดได้ทันท่วงที ในการบริการของพวกเรานั้น คุณจะพบกับรูปแบบกราฟล่าสุดและมีความสำคัญมากที่สุดในทุกๆคู่สกุลเงิน และทุกๆขอบเขตเวลา
Bearish Symmetrical Triangle
was formed on 28.03 at 23:49:41 (UTC+0)
signal strength 1 of 5
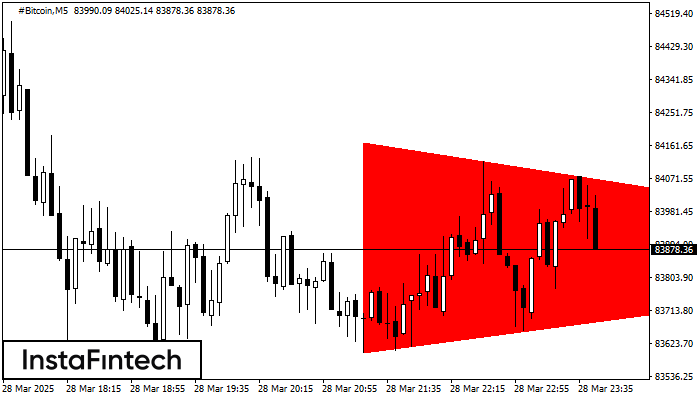
According to the chart of M5, #Bitcoin formed the Bearish Symmetrical Triangle pattern. Trading recommendations: A breach of the lower border 83601.23 is likely to encourage a continuation of the downward trend.
The M5 and M15 time frames may have more false entry points.
ดูเพิ่มเติม
- All
- All
- Bearish Rectangle
- Bearish Symmetrical Triangle
- Bearish Symmetrical Triangle
- Bullish Rectangle
- Double Top
- Double Top
- Triple Bottom
- Triple Bottom
- Triple Top
- Triple Top
- All
- All
- Buy
- Sale
- All
- 1
- 2
- 3
- 4
- 5
Bullish Symmetrical Triangle
сформирован 07.04 в 04:20:08 (UTC+0)
сила сигнала 2 из 5
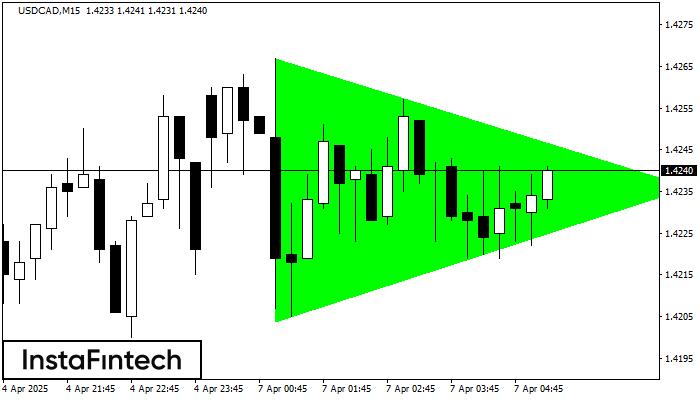
According to the chart of M15, USDCAD formed the Bullish Symmetrical Triangle pattern. Description: This is the pattern of a trend continuation. 1.4267 and 1.4204 are the coordinates
The M5 and M15 time frames may have more false entry points.
Открыть график инструмента в новом окне
Double Top
сформирован 07.04 в 03:44:54 (UTC+0)
сила сигнала 1 из 5
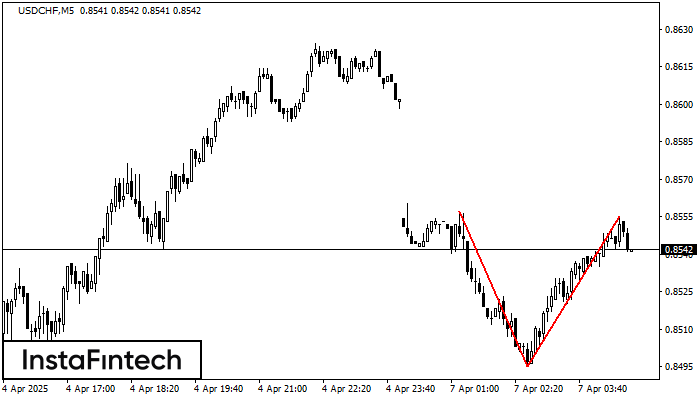
On the chart of USDCHF M5 the Double Top reversal pattern has been formed. Characteristics: the upper boundary 0.8555; the lower boundary 0.8495; the width of the pattern 60 points
The M5 and M15 time frames may have more false entry points.
Открыть график инструмента в новом окне
Triple Bottom
сформирован 07.04 в 03:10:11 (UTC+0)
сила сигнала 1 из 5

The Triple Bottom pattern has been formed on GOLD M5. It has the following characteristics: resistance level 3009.08/2992.38; support level 2976.74/2972.63; the width is 3234 points. In the event
The M5 and M15 time frames may have more false entry points.
Открыть график инструмента в новом окне