Dolzarb patternlar

Прямоугольник
сформирован 18.03 в 15:36:48 (UTC+0)
сила сигнала 1 из 5
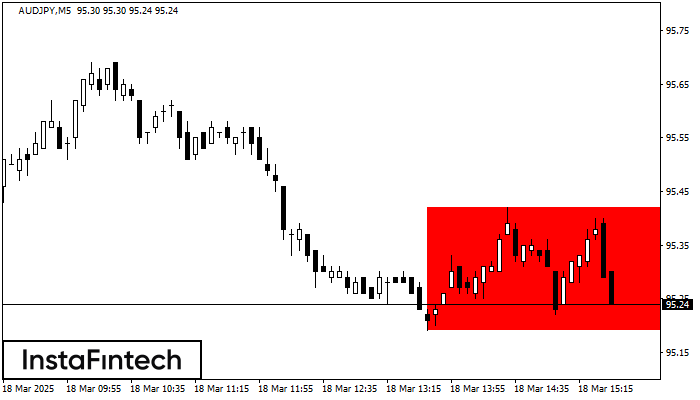
По AUDJPY M5 сформировалась фигура - «Прямоугольник». Фигура данного типа относится к тому типу продолжения тренда, который имеет два уровня: Сопротивление 95.42; Поддержка 95.19. В случае пробоя уровня поддержки 95.19 возможно дальнейшее нисходящее движение.
Таймфреймы М5 и М15 могут иметь больше ложных точек входа.
- Все
- Все
- Bearish Rectangle
- Bearish Symmetrical Triangle
- Bearish Symmetrical Triangle
- Bullish Rectangle
- Double Top
- Double Top
- Triple Bottom
- Triple Bottom
- Triple Top
- Triple Top
- Все
- Все
- Покупка
- Продажа
- Все
- 1
- 2
- 3
- 4
- 5
Bullish Symmetrical Triangle
was formed on 21.03 at 20:20:31 (UTC+0)
signal strength 1 of 5

According to the chart of M5, #GOOG formed the Bullish Symmetrical Triangle pattern, which signals the trend will continue. Description. The upper border of the pattern touches the coordinates 165.68/165.13
The M5 and M15 time frames may have more false entry points.
Open chart in a new window
Double Top
was formed on 21.03 at 20:10:26 (UTC+0)
signal strength 1 of 5
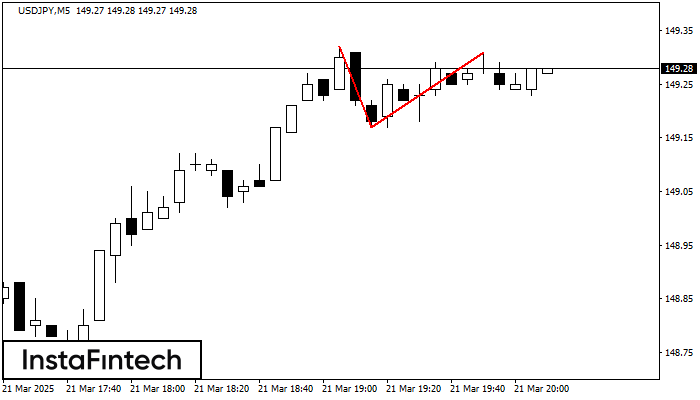
On the chart of USDJPY M5 the Double Top reversal pattern has been formed. Characteristics: the upper boundary 149.31; the lower boundary 149.17; the width of the pattern 14 points
The M5 and M15 time frames may have more false entry points.
Open chart in a new window
Double Top
was formed on 21.03 at 20:00:35 (UTC+0)
signal strength 1 of 5
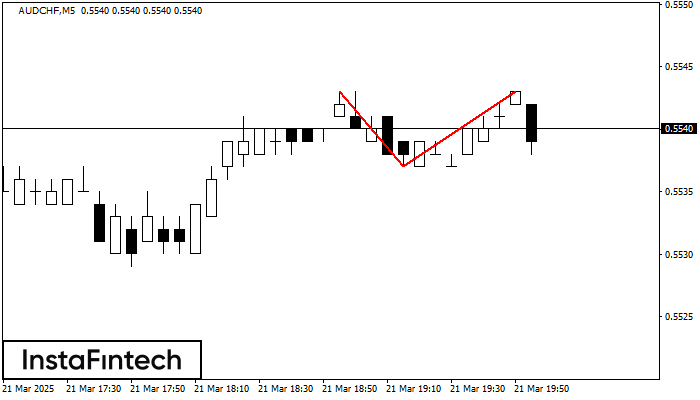
The Double Top reversal pattern has been formed on AUDCHF M5. Characteristics: the upper boundary 0.5543; the lower boundary 0.5537; the width of the pattern is 6 points. Sell trades
The M5 and M15 time frames may have more false entry points.
Open chart in a new window