Dolzarb patternlar

Тройная вершина
сформирован 31.03 в 08:30:26 (UTC+0)
сила сигнала 3 из 5

На графике EURCAD M30 образовалась фигура «Тройная вершина», которая сигнализирует об изменении тенденции. Возможный сценарий: После формирования третьей вершины котировка постарается пробить нижнюю границу 1.5505, где трейдеру и стоило бы открывать торговую позицию на продажу. Тейк Профит - это и есть проекция ширины фигуры, которая составляет 16 пунктов.
Shuningdek ko'ring
- Все
- Все
- Bearish Rectangle
- Bearish Symmetrical Triangle
- Bearish Symmetrical Triangle
- Bullish Rectangle
- Double Top
- Double Top
- Triple Bottom
- Triple Bottom
- Triple Top
- Triple Top
- Все
- Все
- Покупка
- Продажа
- Все
- 1
- 2
- 3
- 4
- 5
Bullish Symmetrical Triangle
was formed on 07.04 at 04:20:08 (UTC+0)
signal strength 2 of 5
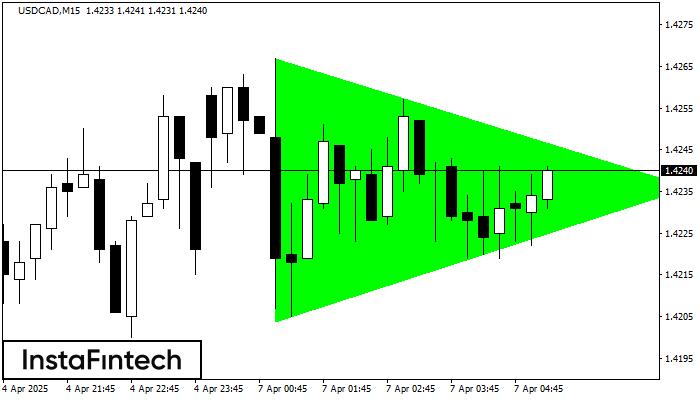
According to the chart of M15, USDCAD formed the Bullish Symmetrical Triangle pattern. Description: This is the pattern of a trend continuation. 1.4267 and 1.4204 are the coordinates
The M5 and M15 time frames may have more false entry points.
Open chart in a new window
Double Top
was formed on 07.04 at 03:44:54 (UTC+0)
signal strength 1 of 5
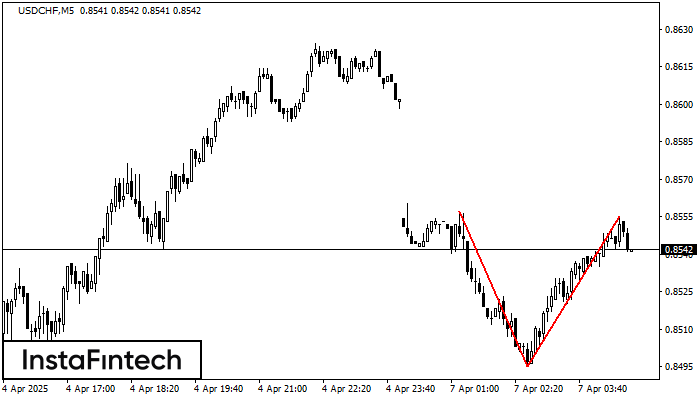
On the chart of USDCHF M5 the Double Top reversal pattern has been formed. Characteristics: the upper boundary 0.8555; the lower boundary 0.8495; the width of the pattern 60 points
The M5 and M15 time frames may have more false entry points.
Open chart in a new window
Triple Bottom
was formed on 07.04 at 03:10:11 (UTC+0)
signal strength 1 of 5

The Triple Bottom pattern has been formed on GOLD M5. It has the following characteristics: resistance level 3009.08/2992.38; support level 2976.74/2972.63; the width is 3234 points. In the event
The M5 and M15 time frames may have more false entry points.
Open chart in a new window