Dolzarb patternlar

Двойная вершина
сформирован 07.04 в 02:00:14 (UTC+0)
сила сигнала 1 из 5
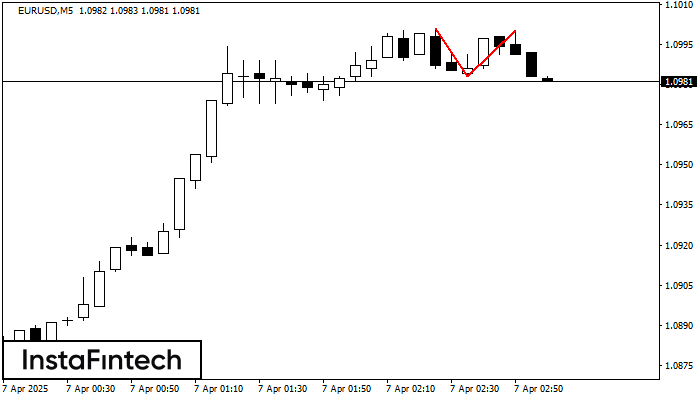
На торговом графике EURUSD M5 сформировалась разворотная фигура «Двойная вершина». Характеристика: Верхняя граница 1.1000; Нижняя граница 1.0983; Ширина фигуры 17 пунктов. Сигнал: Пробой нижней границы 1.0983 приведет к дальнейшему нисходящему движению с перспективой хода к уровню 1.0968.
Таймфреймы М5 и М15 могут иметь больше ложных точек входа.
Shuningdek ko'ring
- Все
- Все
- Bearish Rectangle
- Bearish Symmetrical Triangle
- Bearish Symmetrical Triangle
- Bullish Rectangle
- Double Top
- Double Top
- Triple Bottom
- Triple Bottom
- Triple Top
- Triple Top
- Все
- Все
- Покупка
- Продажа
- Все
- 1
- 2
- 3
- 4
- 5
Bullish Rectangle
сформирован 14.04 в 04:08:09 (UTC+0)
сила сигнала 2 из 5
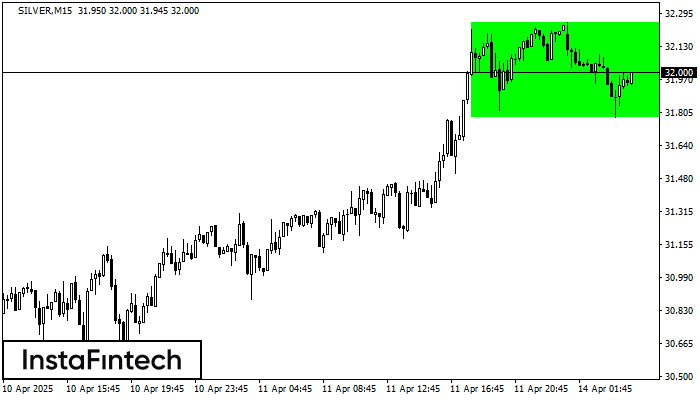
According to the chart of M15, SILVER formed the Bullish Rectangle. This type of a pattern indicates a trend continuation. It consists of two levels: resistance 32.25 and support 31.78
The M5 and M15 time frames may have more false entry points.
Открыть график инструмента в новом окне
Bullish Symmetrical Triangle
сформирован 14.04 в 04:00:58 (UTC+0)
сила сигнала 4 из 5

According to the chart of H1, EURNZD formed the Bullish Symmetrical Triangle pattern. Description: This is the pattern of a trend continuation. 2.0005 and 1.9118 are the coordinates
Открыть график инструмента в новом окне
Bullish Rectangle
сформирован 14.04 в 03:32:18 (UTC+0)
сила сигнала 1 из 5
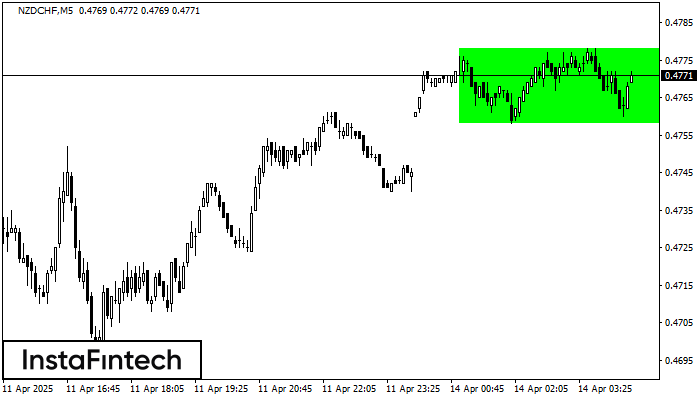
According to the chart of M5, NZDCHF formed the Bullish Rectangle. The pattern indicates a trend continuation. The upper border is 0.4778, the lower border is 0.4758. The signal means
The M5 and M15 time frames may have more false entry points.
Открыть график инструмента в новом окне